Experian 2009 Annual Report Download - page 18
Download and view the complete annual report
Please find page 18 of the 2009 Experian annual report below. You can navigate through the pages in the report by either clicking on the pages listed below, or by using the keyword search tool below to find specific information within the annual report.-
 1
1 -
2
-
3
-
4
-
5
-
6
-
7
-
 8
8 -
 9
9 -
 10
10 -
 11
11 -
 12
12 -
 13
13 -
 14
14 -
 15
15 -
 16
16 -
 17
17 -
 18
18 -
 19
19 -
 20
20 -
 21
21 -
 22
22 -
 23
23 -
 24
24 -
 25
25 -
 26
26 -
 27
27 -
 28
28 -
29
-
30
-
31
-
32
-
33
-
34
-
35
-
36
-
37
-
38
-
39
-
40
-
41
-
42
-
43
-
44
-
45
-
46
-
47
-
48
-
49
-
50
-
51
-
52
-
53
-
54
-
55
-
56
-
57
-
58
-
59
-
60
-
61
-
62
-
63
-
64
-
65
-
66
-
67
-
68
-
69
-
70
-
71
-
72
-
73
-
74
-
75
-
76
-
77
-
78
-
79
-
80
-
81
-
82
-
83
-
84
-
85
-
86
-
87
-
88
-
89
-
90
-
91
-
92
-
93
-
94
-
95
-
96
-
97
-
98
-
99
-
100
-
101
-
102
-
103
-
104
-
105
-
106
-
107
-
108
-
109
-
110
-
111
-
112
-
113
-
114
-
115
-
116
-
117
-
118
-
119
-
120
-
121
-
122
-
123
-
124
-
125
-
126
-
127
-
128
-
129
-
130
-
131
-
132
-
133
-
134
-
135
-
136
-
137
-
138
-
139
-
140
-
141
-
142
-
143
-
144
-
145
-
146
-
147
-
148
-
149
-
150
-
151
-
152
 |
 |

16 Experian Annual Report 2009
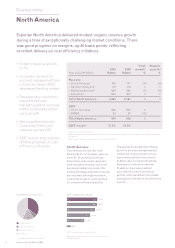
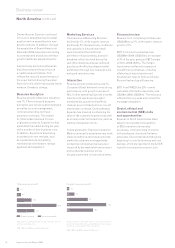
North America continued
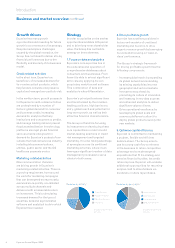
During the year, Experian continued
to focus on strengthening its market
position and on expanding into new
growth verticals. In addition, through
the acquisition of Search
America
in
December 2008, Experian is extending
its core data and analytics to the fast-
growth healthcare payments sector.
As previously announced, Experian
has discontinued efforts to launch
a credit bureau in Canada. This
reects the reduced attractiveness of
the opportunity following the global
nancial crisis, which has caused lender
needs in Canada to change.
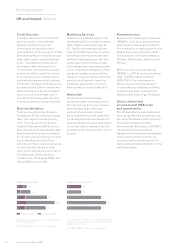
Decision Analytics
Revenue growth at Decision Analytics
was 1%. There was good progress
during the year across custom analytics,
as well as account management,
commercial lending and fraud
prevention software. This helped
to offset weaker demand for loan
origination products. Experian further
penetrated the market during the year,
with a number of new business wins.
In addition, Experian is developing
its presence in new verticals, such
as capital markets, by building
relationships with lenders, ratings
agencies and regulators.
Marketing Services
Total revenue at Marketing Services
declined by 1%, while organic revenue
declined by 2%. Recessionary conditions
and cutbacks in discretionary retail
spend impacted the traditional
activities of list processing, data and
database, which declined during the
year. New media businesses delivered
good growth reecting deeper market
penetration through new business wins
and good retention rates.
Interactive
Revenue growth at Interactive was 7%.
Consumer Direct delivered a very strong
performance, with growth in excess of
20%, further extending Experian’s market
lead. Growth was driven by higher
memberships, growth in the afnity
channel, plus contribution from one-off
data breach contracts. During the year,
Experian has invested in enhancing the
value of the customer experience as well
as in new product introductions, such as
identity management tools.
In lead generation, Experian Interactive
Media continued to experience very weak
market conditions as lenders exited the
market for subprime mortgage leads.
Comparison shopping revenues were
impacted by the weak retail environment
and by adverse business mix as
shoppers switched to lower value items.
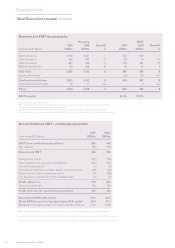
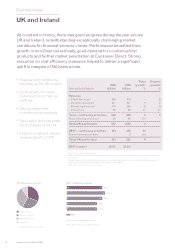
Financial review
Revenue from continuing activities was
US$2,083m, up 1%, with organic revenue
growth of 1%.
EBIT from direct businesses was
US$568m (2008: US$554m), an increase
of 3% in the year, giving an EBIT margin
of 27.3% (2008: 26.9%). The margin
improvement reected progress on
cost efciency initiatives, including
offshoring of administrative and
development roles to Chile and Costa
Rica and technology efciencies.
EBIT from FARES, the 20%-owned
real estate information associate, was
US$48m (2008: US$54m). The reduction
reected the very weak environment for
mortgage origination.
Social, ethical and
environmental (SEE) risks
and opportunities
Experian in North America has taken
steps to incorporate consideration
of SEE issues into its everyday
processes, communicating its stance
with employees, clients and industry
advocates. Environmental initiatives are
beginning to contribute energy and cost
savings, which are reported in the full CR
report at www.experiancrreport.com.
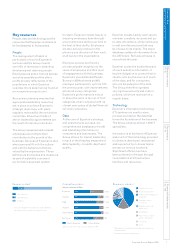
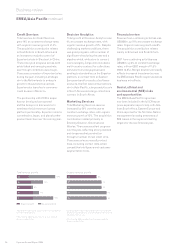
Organic revenue growth
1%
3%
8%
15%
10%
Organic growth is dened as year-on-year revenue growth
at constant exchange rates, excluding acquisitions except
afliates, until the date of their anniversary
2006, 2007 and 2008 exclude MetaReward
09
08
07
06
05
Business review
Total revenue growth
Total growth is dened as year-on-year revenue growth at
constant exchange rates
2006, 2007 and 2008 exclude MetaReward
40%
15%
Organic growth Acquired growth
4%
18%
1%
09
07
06
05
08