Experian 2009 Annual Report Download - page 112
Download and view the complete annual report
Please find page 112 of the 2009 Experian annual report below. You can navigate through the pages in the report by either clicking on the pages listed below, or by using the keyword search tool below to find specific information within the annual report.-
 1
1 -
2
-
3
-
4
-
5
-
6
-
7
-
8
-
9
-
10
-
11
-
12
-
13
-
14
-
15
-
16
-
17
-
18
-
19
-
20
-
21
-
22
-
23
-
24
-
25
-
26
-
27
-
28
-
29
-
30
-
31
-
32
-
33
-
34
-
35
-
36
-
37
-
38
-
39
-
40
-
41
-
42
-
43
-
44
-
45
-
46
-
47
-
48
-
49
-
50
-
51
-
52
-
53
-
54
-
55
-
56
-
57
-
58
-
59
-
60
-
61
-
62
-
63
-
64
-
65
-
66
-
67
-
68
-
69
-
70
-
71
-
72
-
73
-
74
-
75
-
76
-
77
-
78
-
79
-
80
-
81
-
82
-
83
-
84
-
85
-
86
-
87
-
88
-
89
-
90
-
91
-
92
-
93
-
94
-
95
-
96
-
97
-
98
-
99
-
100
-
101
-
 102
102 -
 103
103 -
 104
104 -
 105
105 -
 106
106 -
 107
107 -
 108
108 -
 109
109 -
 110
110 -
 111
111 -
 112
112 -
 113
113 -
 114
114 -
 115
115 -
 116
116 -
 117
117 -
 118
118 -
 119
119 -
 120
120 -
 121
121 -
 122
122 -
123
-
124
-
125
-
126
-
127
-
128
-
129
-
130
-
131
-
132
-
133
-
134
-
135
-
136
-
137
-
138
-
139
-
140
-
141
-
142
-
143
-
144
-
145
-
146
-
147
-
148
-
149
-
150
-
151
-
152
 |
 |

110 Experian Annual Report 2009
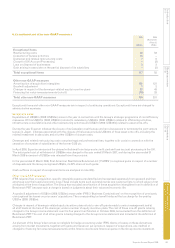
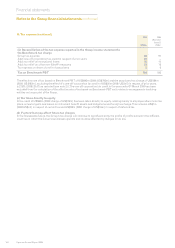
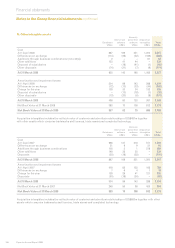
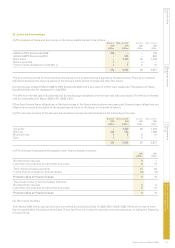
17. Investments in associates
2009 2008
US$m US$m
Cost
At 1 April 295 286
Differences on exchange (1) –
Additions 29 5
Share of prot after tax including a pre-tax exceptional gain of US$nil (2008: US$3m) (note 8) 42 50
Dividends received (28) (36)
Acquisition of controlling stake in associate – (10)
Write-down of investment in Japan (5) –
At 31 March 332 295
Investments in associates at 31 March 2009 include goodwill of US$224m (2008: US$228m). The Group’s share of cumulative
retained prots of associated undertakings at 31 March 2009 is US$155m (2008: US$141m).
The Group’s principal interest in associated undertakings is a 20% holding of FARES, which in incorporated in the USA. At
31 March 2009, the Group’s share of the assets of FARES amounted to US$500m (2008: US$497m) and its share of liabilities is
US$202m (2008: US$202m). The Group’s share of the revenue of FARES for the year ended 31 March 2009 is US$237m
(2008: US$249m) and its share of prot after tax US$46m (2008: US$50m).
First American Corporation, which holds the balance of the capital of FARES, has the right to acquire from Experian its interest
in FARES at a purchase price pursuant to a specied formula based on the after tax earnings of FARES. Whilst First American
Corporation is now able to exercise this right, no such notice had been received at 31 March 2009. Experian can elect to delay
completion of the transaction for a maximum period of two years following First American Corporation giving such notice.
The Group’s interests in other associated undertakings are not individually material but include additions in the year ended
31 March 2009 of US$29m, in respect of a 40% stake in DP Information Group in Singapore and an investment in Japan with
CCB. Singapore and Japan are the respective countries of incorporation of these businesses.
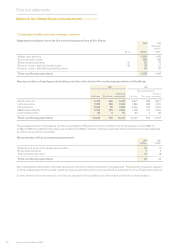
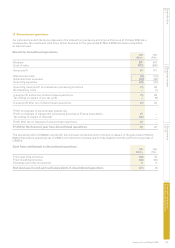
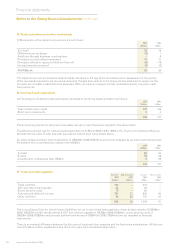
18. Inventories
2009 2008
US$m US$m
Work in progress 2 2
Finished goods 2 2
4 4
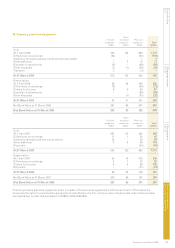
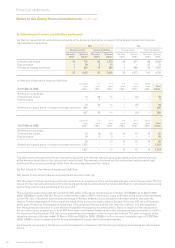
19. Trade and other receivables
(a) The analysis of trade and other receivables disclosed in the Group balance sheet is as follows:
Current Non-current Current Non-current
2009 2009 2008 2008
US$m US$m US$m US$m
Trade receivables 546 – 768 –
Less: provision for impairment of trade receivables (25) – (24) –
Less: other provisions in respect of trade receivables (17) – (19) –
Trade receivables – net 504 – 725 –
Amounts owed by associates 2 – 3 –
VAT recoverable 1 – 1 –
Other prepayments and accrued income 231 5 302 9
738 5 1,031 9
The accounting policies for loans and receivables set out in note 2 have been applied to nancial instruments of US$590m
(2008: US$856m) within the above items. VAT recoverable of US$1m (2008: US$1m) and prepayments of US$152m
(2008: US$183m) are not regarded as nancial instruments.
There is no material difference between the fair value of trade and other receivables and the book value stated above. All non-
current trade and other receivables are due within ve years from the balance sheet date.
Notes to the Group nancial statements continued
Financial statements