Experian 2009 Annual Report Download - page 12
Download and view the complete annual report
Please find page 12 of the 2009 Experian annual report below. You can navigate through the pages in the report by either clicking on the pages listed below, or by using the keyword search tool below to find specific information within the annual report.-
 1
1 -
 2
2 -
 3
3 -
 4
4 -
 5
5 -
 6
6 -
 7
7 -
 8
8 -
 9
9 -
 10
10 -
 11
11 -
 12
12 -
 13
13 -
 14
14 -
 15
15 -
 16
16 -
 17
17 -
 18
18 -
 19
19 -
 20
20 -
 21
21 -
 22
22 -
23
-
24
-
25
-
26
-
27
-
28
-
29
-
30
-
31
-
32
-
33
-
34
-
35
-
36
-
37
-
38
-
39
-
40
-
41
-
42
-
43
-
44
-
45
-
46
-
47
-
48
-
49
-
50
-
51
-
52
-
53
-
54
-
55
-
56
-
57
-
58
-
59
-
60
-
61
-
62
-
63
-
64
-
65
-
66
-
67
-
68
-
69
-
70
-
71
-
72
-
73
-
74
-
75
-
76
-
77
-
78
-
79
-
80
-
81
-
82
-
83
-
84
-
85
-
86
-
87
-
88
-
89
-
90
-
91
-
92
-
93
-
94
-
95
-
96
-
97
-
98
-
99
-
100
-
101
-
102
-
103
-
104
-
105
-
106
-
107
-
108
-
109
-
110
-
111
-
112
-
113
-
114
-
115
-
116
-
117
-
118
-
119
-
120
-
121
-
122
-
123
-
124
-
125
-
126
-
127
-
128
-
129
-
130
-
131
-
132
-
133
-
134
-
135
-
136
-
137
-
138
-
139
-
140
-
141
-
142
-
143
-
144
-
145
-
146
-
147
-
148
-
149
-
150
-
151
-
152
 |
 |

10 Experian Annual Report 2009
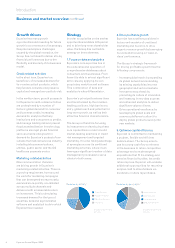
Business review
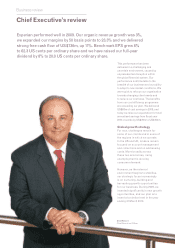
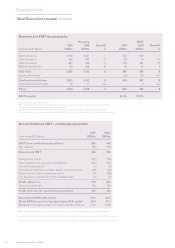
Chief Executive’s review continued
Revenue and EBIT by geography
Revenue EBIT
2009 2008 Growth1 2009 2008 Growth1
Year ended 31 March US$m US$m % US$m US$m %
North America 2,083 2,061 1 616 608 1
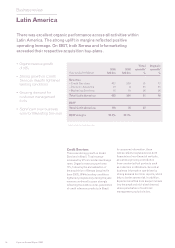
Latin America 462 324 51 118 75 67
UK and Ireland 850 959 5 213 226 10
EMEA/Asia Pacic2 426 368 19 49 50 3
Sub total 3,821 3,712 8 996 959 9
Central Activities3 - - - (57) (57) n/a
Continuing activities 3,821 3,712 8 939 902 8
Discontinuing activities4 52 77 n/a - 6 n/a
Total 3,873 3,789 8 939 908 8
EBIT margin5 23.3% 22.8%
1 Total growth at constant exchange rates
2 2008 restated to exclude French transaction processing activities, which are now classied as a discontinued operation
3 Central Activities comprise costs of central corporate functions
4 Discontinuing activities include UK account processing, Loyalty Solutions and other smaller discontinuing activities
5 EBIT margin is for continuing business only, excluding FARES. Further analysis can be found in the nancial review on page 37
Reconciliation of EBIT – continuing operations
2009 20081
Year ended 31 March US$m US$m
EBIT from continuing operations1 939 908
Net interest1 (96) (125)
Benchmark PBT 843 783
Exceptional items1 (117) (55)
Amortisation of acquisition intangibles (132) (121)
Goodwill adjustment (1) (2)
Charges for demerger-related equity incentive plans (32) (49)
Financing fair value remeasurements 19 (29)
Tax expense on share of prots of associates (2) (6)
Prot before tax 578 521
Group tax expense1 (84) (91)
Prot after tax for continuing operations 494 430
Benchmark EPS (US cents)1 62.3 57.5
Basic EPS for continuing operations (US cents)1 46.8 41.1
Weighted average number of ordinary shares (million) 1,013 1,009
1 2008 restated to exclude French transaction processing activities, which are now classied as a discontinued operation
See page 37 for analysis of revenue and EBIT by principal activity and page 38 for reconciliation of revenue and EBIT by geography
See the nancial review on page 37 and note 2 to the Group nancial statements on page 90 for denitions of non-GAAP measures