Experian 2009 Annual Report Download - page 104
Download and view the complete annual report
Please find page 104 of the 2009 Experian annual report below. You can navigate through the pages in the report by either clicking on the pages listed below, or by using the keyword search tool below to find specific information within the annual report.-
 1
1 -
2
-
3
-
4
-
5
-
6
-
7
-
8
-
9
-
10
-
11
-
12
-
13
-
14
-
15
-
16
-
17
-
18
-
19
-
20
-
21
-
22
-
23
-
24
-
25
-
26
-
27
-
28
-
29
-
30
-
31
-
32
-
33
-
34
-
35
-
36
-
37
-
38
-
39
-
40
-
41
-
42
-
43
-
44
-
45
-
46
-
47
-
48
-
49
-
50
-
51
-
52
-
53
-
54
-
55
-
56
-
57
-
58
-
59
-
60
-
61
-
62
-
63
-
64
-
65
-
66
-
67
-
68
-
69
-
70
-
71
-
72
-
73
-
74
-
75
-
76
-
77
-
78
-
79
-
80
-
81
-
82
-
83
-
84
-
85
-
86
-
87
-
88
-
89
-
90
-
91
-
92
-
93
-
 94
94 -
 95
95 -
 96
96 -
 97
97 -
 98
98 -
 99
99 -
 100
100 -
 101
101 -
 102
102 -
 103
103 -
 104
104 -
 105
105 -
 106
106 -
 107
107 -
 108
108 -
 109
109 -
 110
110 -
 111
111 -
 112
112 -
 113
113 -
 114
114 -
115
-
116
-
117
-
118
-
119
-
120
-
121
-
122
-
123
-
124
-
125
-
126
-
127
-
128
-
129
-
130
-
131
-
132
-
133
-
134
-
135
-
136
-
137
-
138
-
139
-
140
-
141
-
142
-
143
-
144
-
145
-
146
-
147
-
148
-
149
-
150
-
151
-
152
 |
 |

102 Experian Annual Report 2009
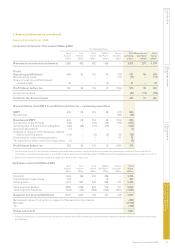
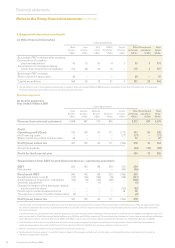
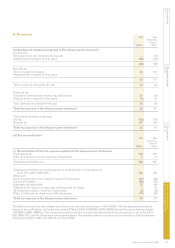
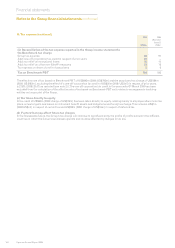
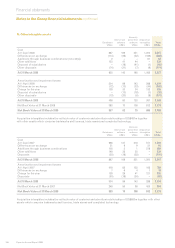
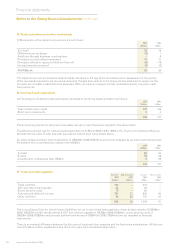
9. Net nancing costs
2009 2008
(Restated)
(Note 2)
US$m US$m
(a) Net nancing costs
Interest income:
Bank deposits and money market funds 16 19
Interest differentials on derivatives 12 1
Expected return on pension plan assets 69 76
Interest income 97 96
Financing fair value gains:
Gains on interest rate swaps – fair value hedges 53 34
Ineffective portion of net investment hedges – 7
Foreign exchange transaction gains 11 –
Movement in fair value of Serasa put option 21 69
Financing fair value gains 85 110
Finance income 182 206
Interest expense:
Bank loans and overdrafts 41 71
Eurobonds and notes 61 90
Commitment and facility utilisation fees 1 1
Unwind of discounts on provisions 6 4
Interest differentials on derivatives 30 –
Finance lease interest expense 2 2
Interest expense on pension plan liabilities 52 53
Interest expense 193 221
Financing fair value losses:
Fair value losses on borrowings attributable to interest rate risk 51 35
Fair value losses on non-hedging derivatives 15 98
Foreign exchange transaction losses – 6
Financing fair value losses 66 139
Finance expense 259 360
Net nancing costs 77 154
(b) Net interest expense included in Benchmark PBT
Net nancing costs 77 154
Financing fair value remeasurements 19 (29)
Net interest expense included in Benchmark PBT 96 125
(c) Financing fair value remeasurements included in net nancing costs
Financing fair value gains 85 110
Financing fair value losses (66) (139)
Credit/(charge) in respect of nancing fair value remeasurements 19 (29)
An indication of the sensitivity of the Group’s results to interest rate risk is given in note 3.
Notes to the Group nancial statements continued
Financial statements