Experian 2009 Annual Report Download - page 32
Download and view the complete annual report
Please find page 32 of the 2009 Experian annual report below. You can navigate through the pages in the report by either clicking on the pages listed below, or by using the keyword search tool below to find specific information within the annual report.-
 1
1 -
2
-
3
-
4
-
5
-
6
-
7
-
8
-
9
-
10
-
11
-
12
-
13
-
14
-
15
-
16
-
17
-
18
-
19
-
20
-
21
-
 22
22 -
 23
23 -
 24
24 -
 25
25 -
 26
26 -
 27
27 -
 28
28 -
 29
29 -
 30
30 -
 31
31 -
 32
32 -
 33
33 -
 34
34 -
 35
35 -
 36
36 -
 37
37 -
 38
38 -
 39
39 -
 40
40 -
 41
41 -
 42
42 -
43
-
44
-
45
-
46
-
47
-
48
-
49
-
50
-
51
-
52
-
53
-
54
-
55
-
56
-
57
-
58
-
59
-
60
-
61
-
62
-
63
-
64
-
65
-
66
-
67
-
68
-
69
-
70
-
71
-
72
-
73
-
74
-
75
-
76
-
77
-
78
-
79
-
80
-
81
-
82
-
83
-
84
-
85
-
86
-
87
-
88
-
89
-
90
-
91
-
92
-
93
-
94
-
95
-
96
-
97
-
98
-
99
-
100
-
101
-
102
-
103
-
104
-
105
-
106
-
107
-
108
-
109
-
110
-
111
-
112
-
113
-
114
-
115
-
116
-
117
-
118
-
119
-
120
-
121
-
122
-
123
-
124
-
125
-
126
-
127
-
128
-
129
-
130
-
131
-
132
-
133
-
134
-
135
-
136
-
137
-
138
-
139
-
140
-
141
-
142
-
143
-
144
-
145
-
146
-
147
-
148
-
149
-
150
-
151
-
152
 |
 |

30 Experian Annual Report 2009
Financial review
Business review
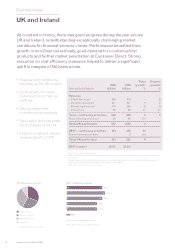
The Group made further sound nancial progress in a very
challenging year with good revenue, prot and cash performance.
Revenue and prot performance
Group revenue from continuing
operations increased by 2% from
US$3,789m to US$3,873m, including
the benet of acquisitions. At constant
exchange rates, Group revenue from
continuing operations grew by 8%.
Prot before tax increased by 11%, from
US$521m in the year ended 31 March
2008 to US$578 in the year ended
31 March 2009.
Benchmark PBT for continuing
operations rose by US$60m to
US$843m (2008: US$783m). At
constant exchange rates, EBIT from
continuing operations increased by 8%
to US$939m. This increase arose from
the increase in revenue in continuing
operations, together with the benet of
the Group’s previously announced cost
reduction programme.
Taxation
The Group’s effective rate of tax for the
year based on Benchmark PBT was
21.8% (2008: 23.4%). This rate is dened
as the total tax expense adjusted for
the tax impact of non-Benchmark
items and further excluding the benet
of a one-off corporation tax credit of
US$20m (2008: US$nil) that relates
to arrangements involving entities no
longer part of the Group, divided by
Benchmark PBT. The Group’s cash tax
rate for continuing operations (based
on tax paid in the year and Benchmark
PBT for continuing operations) was
4.6% (2008: 10.1%).
Earnings and dividends
per share
Basic earnings per share were 48.0 US
cents (2008: 43.3 US cents), including
1.2 US cents (2008: 2.2 US cents) in
respect of discontinued operations.
Benchmark earnings per share
increased to 62.3 US cents from
57.5 US cents last year.
The board has announced a second
interim dividend of 13.25 US cents per
ordinary share (2008: 12.00 US cents),
giving a total dividend per share of
20.00 US cents for the full year
(2008: 18.50 US cents), an increase
of 8%, which is covered 3.1 times by
Benchmark earnings per share.
Share price and total equity
The share price of Experian ranged
from a low of 274.75p to a high of 453.25p
during the year. On 31 March 2009, the
mid market price was 436.75p, giving a
market capitalisation of US$6.4bn at
that date (2008: US$7.4bn).
Total equity at 31 March 2009 amounted
to US$1,899m (2008: US$2,117m), which
is equivalent to US$1.87 per share (2008:
US$2.09), excluding own shares held by
employee trusts.
Actuarial losses of US$202m in
respect of dened benet pension
plans and currency translation losses
of US$428m, mainly as a result of the
weakening of sterling, have contributed
to the decrease in total equity during
the year.
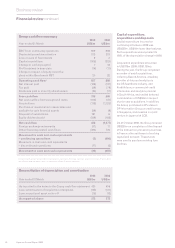
Cash ow, net debt and funding
The Group seeks to ensure that
sufcient liquidity is available to meet
its foreseeable needs and to invest
its cash assets safely and protably.
It has continued to be strongly cash
generative in the year with operating
cash ow of US$927m (2008: US$886m)
and a cash ow conversion of 99%.
As indicated in the table below, the
Group’s free cash ow in the year ended
31 March 2009 was US$743m compared
with US$665m in 2008.
Free cash ow was used to fund
acquisitions of US$179m and equity
dividends of US$189m. Cash outow
from exceptional items amounted to
US$102m. The net cash inow for the
year was US$428m (2008: US$1,277m
outow).
At 31 March 2009, net debt was
US$2,110m (2008: US$2,699m). The
maturity, currency and interest rate
proles of the Group’s loans and
borrowings are shown in note 26 to
the Group nancial statements. Debt
maturities are spread over the next ve
years, to avoid excessive concentration
of renancing needs. At 31 March 2009
undrawn committed borrowing facilities
totalled US$1,050m (2008: US$1,121m).
There have been no defaults under any
covenants given on the Group’s loans
and borrowings in the current or the
prior year.
During the year ended 31 March 2009,
6.375% Eurobonds 2009 with a par
value of £147m were redeemed out of
free cash ow. The balance of these
Eurobonds, which was £203m at 31
March 2009, falls due for repayment in
July 2009. It is expected that this will be
funded from drawings under existing
committed borrowing facilities.
In the year ended 31 March 2009, the
Group’s net interest expense was
US$96m (2008: US$125m). This expense
is stated after crediting US$17m (2008:
US$23m) in respect of the expected
return on pension assets over the
interest on pension liabilities. The
reduction of US$35m in the other
elements of the Group’s net interest
expense stems from the environment of
declining global interest rates together
with the benet of the Group’s strong
cash ow performance.