DIRECTV 2004 Annual Report Download - page 97
Download and view the complete annual report
Please find page 97 of the 2004 DIRECTV annual report below. You can navigate through the pages in the report by either clicking on the pages listed below, or by using the keyword search tool below to find specific information within the annual report.-
 1
1 -
2
-
3
-
4
-
5
-
6
-
7
-
8
-
9
-
10
-
11
-
12
-
13
-
14
-
15
-
16
-
17
-
18
-
19
-
20
-
21
-
22
-
23
-
24
-
25
-
26
-
27
-
28
-
29
-
30
-
31
-
32
-
33
-
34
-
35
-
36
-
37
-
38
-
39
-
40
-
41
-
42
-
43
-
44
-
45
-
46
-
47
-
48
-
49
-
50
-
51
-
52
-
53
-
54
-
55
-
56
-
57
-
58
-
59
-
60
-
61
-
62
-
63
-
64
-
65
-
66
-
67
-
68
-
69
-
70
-
71
-
72
-
73
-
74
-
75
-
76
-
77
-
78
-
79
-
80
-
81
-
82
-
83
-
84
-
85
-
86
-
 87
87 -
 88
88 -
 89
89 -
 90
90 -
 91
91 -
 92
92 -
 93
93 -
 94
94 -
 95
95 -
 96
96 -
 97
97 -
 98
98 -
 99
99 -
 100
100 -
 101
101 -
 102
102 -
 103
103 -
 104
104 -
 105
105 -
 106
106 -
 107
107 -
108
-
109
-
110
-
111
-
112
-
113
-
114
-
115
-
116
-
117
-
118
-
119
-
120
-
121
-
122
-
123
-
124
-
125
-
126
-
127
-
128
-
129
-
130
-
131
-
132
-
133
-
134
-
135
-
136
-
137
 |
 |

THE DIRECTV GROUP, INC.
NOTES TO THE CONSOLIDATED FINANCIAL STATEMENTS — (continued)
We base our expected long-term return on plan assets assumption on a periodic review and modeling of the plans’ asset
allocation and liability structure over a long-term horizon. Expectations of returns for each asset class are the most important of
the assumptions used in the review and modeling and are based on comprehensive reviews of historical data and
economic/financial market theory.
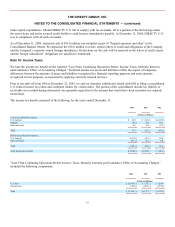
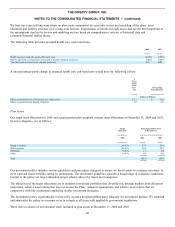
The following table provides assumed health care costs trend rates:
2004
2003
Health care cost trend rate assumed for next year
10.00
%
9.00
%
Rate to which the cost trend rate is assumed to decline (ultimate trend rate)
5.00
%
5.00
%
Year that trend rate reaches the ultimate trend rate
2010
2008
A one-percentage-point change in assumed health care cost trend rates would have the following effects:
1-
Perce
ntage
Point
Incr
ease
1-Percentage
Point Decrease
(Dollars in Millions)
Effect on total of service and interest cost components
$
0.2
$
(0.1
)
Effect on postretirement benefit obligation
1.8
(1.6
)
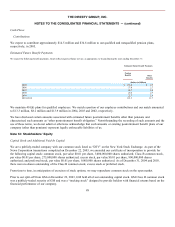
Plan Assets
Our target asset allocation for 2005 and actual pension plan weighted average asset allocations at December 31, 2004 and 2003,
by asset categories, are as follows:
Target
Allocation
Percentage of Plan Assets
at December 31,
2005
2004
2003
Equity securities
50-70
%
55
%
55
%
Debt securities
30-50
%
35
%
35
%
Real estate
0-20
%
2
%
2
%
Other
0-20
%
8
%
8
%
Total
100
%
100
%
Our investment policy includes various guidelines and procedures designed to ensure we invest assets in a manner necessary to
meet expected future benefits earned by participants. The investment guidelines consider a broad range of economic conditions.
Central to the policy are target allocation ranges (shown above) by major asset categories.
The objectives of the target allocations are to maintain investment portfolios that diversify risk through prudent asset allocation
parameters, achieve asset returns that meet or exceed the Plans’ actuarial assumptions, and achieve asset returns that are
competitive with like institutions employing similar investment strategies.
The investment policy is periodically reviewed by us and a designated third-party fiduciary for investment matters. We establish
and administer the policy in a manner so as to comply at all times with applicable government regulations.
There were no shares of our common stock included in plan assets at December 31, 2004 and 2003.
88