DIRECTV 2004 Annual Report Download - page 96
Download and view the complete annual report
Please find page 96 of the 2004 DIRECTV annual report below. You can navigate through the pages in the report by either clicking on the pages listed below, or by using the keyword search tool below to find specific information within the annual report.-
 1
1 -
2
-
3
-
4
-
5
-
6
-
7
-
8
-
9
-
10
-
11
-
12
-
13
-
14
-
15
-
16
-
17
-
18
-
19
-
20
-
21
-
22
-
23
-
24
-
25
-
26
-
27
-
28
-
29
-
30
-
31
-
32
-
33
-
34
-
35
-
36
-
37
-
38
-
39
-
40
-
41
-
42
-
43
-
44
-
45
-
46
-
47
-
48
-
49
-
50
-
51
-
52
-
53
-
54
-
55
-
56
-
57
-
58
-
59
-
60
-
61
-
62
-
63
-
64
-
65
-
66
-
67
-
68
-
69
-
70
-
71
-
72
-
73
-
74
-
75
-
76
-
77
-
78
-
79
-
80
-
81
-
82
-
83
-
84
-
85
-
 86
86 -
 87
87 -
 88
88 -
 89
89 -
 90
90 -
 91
91 -
 92
92 -
 93
93 -
 94
94 -
 95
95 -
 96
96 -
 97
97 -
 98
98 -
 99
99 -
 100
100 -
 101
101 -
 102
102 -
 103
103 -
 104
104 -
 105
105 -
 106
106 -
107
-
108
-
109
-
110
-
111
-
112
-
113
-
114
-
115
-
116
-
117
-
118
-
119
-
120
-
121
-
122
-
123
-
124
-
125
-
126
-
127
-
128
-
129
-
130
-
131
-
132
-
133
-
134
-
135
-
136
-
137
 |
 |

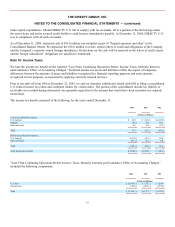
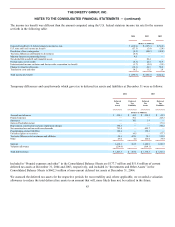
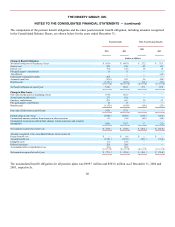
THE DIRECTV GROUP, INC.
NOTES TO THE CONSOLIDATED FINANCIAL STATEMENTS — (continued)
Information for pension plans with an accumulated benefit obligation in excess of plan assets at December 31:
2004
2003
(Dollars in Millions)
Projected benefit obligation
$
532.9
$
561.8
Accumulated benefit obligation
499.7
500.4
Fair value of plan assets
347.4
372.8
Components of net periodic benefit cost for the years ended December 31:
Pension Benefits
Other Postretirement
Benefits
2004
2003
2002
2004
2003
2002
(Dollars in Millions)
Components of net periodic benefit cost
Benefits earned during the year
$
24.2
$
23.0
$
21.7
$
0.5
$
0.5
$
0.5
Interest accrued on benefits earned in prior years
33.8
35.4
33.8
1.6
1.9
2.2
Expected return on assets
(31.6
)
(32.4
)
(36.5
)
—
—
—
Amortization components
Amount resulting from changes in plan provisions
2.2
2.2
2.2
(0.7
)
—
—
Net amount resulting from changes in plan experience and actuarial assumptions
6.1
4.4
3.0
—
—
—
Subtotal
34.7
32.6
24.2
1.4
2.4
2.7
Other costs
Curtailment costs
5.1
—
—
—
—
—
Contractual termination benefits
36.5
—
—
—
—
—
Settlement costs
14.8
—
—
—
—
—
Net periodic benefit cost
$
91.1
$
32.6
$
24.2
$
1.4
$
2.4
$
2.7
Additional information
Increase (decrease) in minimum liability included in other comprehensive income
$
(11.4
)
$
24.4
$
25.2
—
—
—
Assumptions
Weighted-average assumptions used to determine benefit obligations at December 31:
Pension Benefits
Other Postretirement
Benefits
2004
2003
2004
2003
Discount rate
6.00
%
6.14
%
5.75
%
5.89
%
Rate of compensation increase
4.00
%
4.50
%
4.00
%
4.50
%
Weighted-average assumptions used to determine net periodic benefit cost for the years ended December 31:
Pension Benefits
Other Postretirement
Benefits
2004
2003
2002
2004
2003
2002
Discount rate
6.14
%
7.00
%
7.25
%
5.89
%
6.75
%
7.00
%
Expected long-term return on plan assets
9.00
%
9.00
%
9.50
%
—
—
—
Rate of compensation increase
4.50
%
5.00
%
5.00
%
4.50
%
5.00
%
5.00
%
87