DIRECTV 2004 Annual Report Download - page 48
Download and view the complete annual report
Please find page 48 of the 2004 DIRECTV annual report below. You can navigate through the pages in the report by either clicking on the pages listed below, or by using the keyword search tool below to find specific information within the annual report.-
 1
1 -
2
-
3
-
4
-
5
-
6
-
7
-
8
-
9
-
10
-
11
-
12
-
13
-
14
-
15
-
16
-
17
-
18
-
19
-
20
-
21
-
22
-
23
-
24
-
25
-
26
-
27
-
28
-
29
-
30
-
31
-
32
-
33
-
34
-
35
-
36
-
37
-
 38
38 -
 39
39 -
 40
40 -
 41
41 -
 42
42 -
 43
43 -
 44
44 -
 45
45 -
 46
46 -
 47
47 -
 48
48 -
 49
49 -
 50
50 -
 51
51 -
 52
52 -
 53
53 -
 54
54 -
 55
55 -
 56
56 -
 57
57 -
 58
58 -
59
-
60
-
61
-
62
-
63
-
64
-
65
-
66
-
67
-
68
-
69
-
70
-
71
-
72
-
73
-
74
-
75
-
76
-
77
-
78
-
79
-
80
-
81
-
82
-
83
-
84
-
85
-
86
-
87
-
88
-
89
-
90
-
91
-
92
-
93
-
94
-
95
-
96
-
97
-
98
-
99
-
100
-
101
-
102
-
103
-
104
-
105
-
106
-
107
-
108
-
109
-
110
-
111
-
112
-
113
-
114
-
115
-
116
-
117
-
118
-
119
-
120
-
121
-
122
-
123
-
124
-
125
-
126
-
127
-
128
-
129
-
130
-
131
-
132
-
133
-
134
-
135
-
136
-
137
 |
 |

THE DIRECTV GROUP, INC.
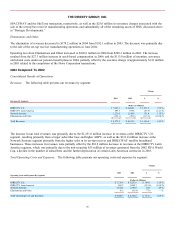
DIRECTV Latin America Segment
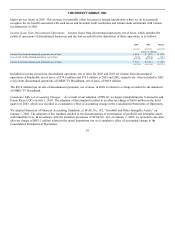
The following table provides operating results and a summary of key subscriber data for the DIRECTV Latin America segment:
Change
2004
2003
$
%
(Dollars in Millions, Except Per Subscriber Amounts)
Revenues
$
675.2
$
597.7
$
77.5
13.0
%
Operating Profit (Loss) Before Depreciation & Amortization
45.9
(85.3
)
131.2
—
%
Operating Loss
(142.0
)
(284.6
)
142.6
50.1
%
Total number of subscribers (000’s)
1,646
1,499
147
9.8
%
Net subscriber additions (losses) (000’s)
57
(83
)
140
—
%
ARPU
$
35.80
$
33.00
$
2.80
8.5
%
The increase in revenues is primarily a result of the larger subscriber base in 2004 as well as the full year impact of
consolidating the Venezuelan and Puerto Rican LOCs.
The 140,000 change in net subscriber additions resulted primarily from lower churn across a majority of the LOCs and the
relatively stable economic conditions in the region, partially offset by the ongoing shut-down of DIRECTV Mexico and the
migration of subscribers to the Sky Mexico platform. This increase in net subscriber additions excludes approximately 89,500
subscribers acquired from the PanAmericana entities as part of the Sky Transactions. The increase in ARPU is primarily due to
the consolidation of the Venezuelan and Puerto Rican LOCs in July 2003 as a result of our adoption of FIN 46 and the
consolidation of Sky Chile and Sky Colombia.
The improvement in operating profit (loss) before depreciation and amortization and operating loss was primarily due to lower
programming costs as a result of the renegotiation of certain contracts in connection with the bankruptcy, partially offset by the
$45.0 million charge related to asset write-downs, severance and other costs related to the ongoing shut-down of DTVLA’s
Mexico operations as part of the Sky Transactions.
Network Systems Segment
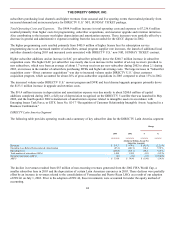
The following table provides operating results for the Network Systems segment:
Change
2004
2003
$
%
(Dollars in Millions)
Revenues
$
1,099.1
$
1,271.0
$
(171.9
)
(13.5
)%
Operating Loss Before Depreciation & Amortization
(1,682.9
)
(32.6
)
(1,650.3
)
—
Operating Loss
(1,778.5
)
(103.4
)
(1,675.1
)
—
The decrease in revenues resulted primarily from lower sales of DIRECTV set-top receivers as a result of the sale of the set-top
receiver manufacturing operations to Thomson in June 2004. As we expect to have significant continuing cash flows with the
set-top receiver manufacturing operations resulting from the five year supply agreement, the financial results of the set-top
receiver manufacturing operations prior to June 2004 are reported in continuing operations, and not as discontinued operations.
See Note 3 to the Consolidated Financial Statements in Item 8, Part II for more information on revenues related to the set-top
receiver manufacturing operations.
The increase in operating loss before depreciation and amortization and operating loss in 2004 compared with 2003 is primarily
due to the $1.466 billion and the $190.6 million in asset impairment charges related to
39