DIRECTV 2004 Annual Report Download - page 49
Download and view the complete annual report
Please find page 49 of the 2004 DIRECTV annual report below. You can navigate through the pages in the report by either clicking on the pages listed below, or by using the keyword search tool below to find specific information within the annual report.-
 1
1 -
2
-
3
-
4
-
5
-
6
-
7
-
8
-
9
-
10
-
11
-
12
-
13
-
14
-
15
-
16
-
17
-
18
-
19
-
20
-
21
-
22
-
23
-
24
-
25
-
26
-
27
-
28
-
29
-
30
-
31
-
32
-
33
-
34
-
35
-
36
-
37
-
38
-
 39
39 -
 40
40 -
 41
41 -
 42
42 -
 43
43 -
 44
44 -
 45
45 -
 46
46 -
 47
47 -
 48
48 -
 49
49 -
 50
50 -
 51
51 -
 52
52 -
 53
53 -
 54
54 -
 55
55 -
 56
56 -
 57
57 -
 58
58 -
 59
59 -
60
-
61
-
62
-
63
-
64
-
65
-
66
-
67
-
68
-
69
-
70
-
71
-
72
-
73
-
74
-
75
-
76
-
77
-
78
-
79
-
80
-
81
-
82
-
83
-
84
-
85
-
86
-
87
-
88
-
89
-
90
-
91
-
92
-
93
-
94
-
95
-
96
-
97
-
98
-
99
-
100
-
101
-
102
-
103
-
104
-
105
-
106
-
107
-
108
-
109
-
110
-
111
-
112
-
113
-
114
-
115
-
116
-
117
-
118
-
119
-
120
-
121
-
122
-
123
-
124
-
125
-
126
-
127
-
128
-
129
-
130
-
131
-
132
-
133
-
134
-
135
-
136
-
137
 |
 |

THE DIRECTV GROUP, INC.
SPACEWAY and the SkyTerra transaction, respectively, as well as the $25.6 million in severance charges associated with the
sale of the set-top box receiver manufacturing operations and substantially all of the remaining assets of HNS, discussed above
in “Strategic Developments.”
Eliminations and Other
The elimination of revenues decreased to $178.2 million in 2004 from $192.1 million in 2003. The decrease was primarily due
to the sale of the set-top receiver manufacturing operations in June 2004.
Operating loss from Eliminations and Other increased to $220.8 million in 2004 from $208.3 million in 2003. The increase
resulted from the $27.3 million increase in stock-based compensation in 2004, and the $113.0 million of retention, severance
and related costs under our pension benefit plans in 2004, partially offset by the one-time charge of approximately $132 million
in 2003 related to the completion of the News Corporation transactions.
2003 Compared To 2002
Consolidated Results of Operations
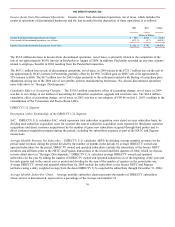
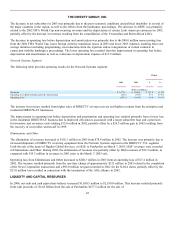
Revenues. The following table presents our revenues by segment:
Change
Revenues By Segment:
2003
2002
$
%
(Dollars in Millions)
DIRECTV U.S.
$
7,695.6
$
6,444.6
$
1,251.0
19.4
%
DIRECTV Latin America
597.7
679.6
(81.9
)
(12.1
)%
Network Systems
1,271.0
1,140.0
131.0
11.5
%
Eliminations and Other
(192.1
)
(78.8
)
(113.3
)
(143.8
)%
Total Revenues
$
9,372.2
$
8,185.4
$
1,186.8
14.5
%
The increase in our total revenues was primarily due to the $1,251.0 million increase in revenues at the DIRECTV U.S.
segment, resulting primarily from a larger subscriber base and higher ARPU, as well as the $131.0 million increase at the
Network Systems segment primarily from the higher sales in its set-top receiver and DIRECWAY satellite broadband
businesses. These increases in revenues were partially offset by the $81.9 million decrease in revenues at the DIRECTV Latin
America segment, which was primarily due to the non-recurring $55 million of revenues generated from the 2002 FIFA World
Cup, a decline in the number of subscribers and the further depreciation of certain Latin American currencies in 2003.
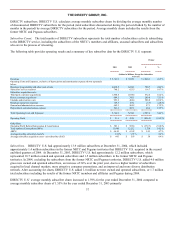
Total Operating Costs and Expenses. The following table presents our operating costs and expenses by segment:
Change
Operating Costs and Expenses By Segment:
2003
2002
$
%
(Dollars in Millions)
DIRECTV U.S.
$
7,236.8
$
6,251.9
$
984.9
15.8
%
DIRECTV Latin America
882.3
1,094.7
(212.4
)
(19.4
)%
Network Systems
1,374.4
1,309.8
64.6
4.9
%
Eliminations and Other
16.2
(61.4
)
77.6
—
%
Total Operating Costs and Expenses
$
9,509.7
$
8,595.0
$
914.7
10.6
%
40