DIRECTV 2004 Annual Report Download - page 88
Download and view the complete annual report
Please find page 88 of the 2004 DIRECTV annual report below. You can navigate through the pages in the report by either clicking on the pages listed below, or by using the keyword search tool below to find specific information within the annual report.-
 1
1 -
2
-
3
-
4
-
5
-
6
-
7
-
8
-
9
-
10
-
11
-
12
-
13
-
14
-
15
-
16
-
17
-
18
-
19
-
20
-
21
-
22
-
23
-
24
-
25
-
26
-
27
-
28
-
29
-
30
-
31
-
32
-
33
-
34
-
35
-
36
-
37
-
38
-
39
-
40
-
41
-
42
-
43
-
44
-
45
-
46
-
47
-
48
-
49
-
50
-
51
-
52
-
53
-
54
-
55
-
56
-
57
-
58
-
59
-
60
-
61
-
62
-
63
-
64
-
65
-
66
-
67
-
68
-
69
-
70
-
71
-
72
-
73
-
74
-
75
-
76
-
77
-
 78
78 -
 79
79 -
 80
80 -
 81
81 -
 82
82 -
 83
83 -
 84
84 -
 85
85 -
 86
86 -
 87
87 -
 88
88 -
 89
89 -
 90
90 -
 91
91 -
 92
92 -
 93
93 -
 94
94 -
 95
95 -
 96
96 -
 97
97 -
 98
98 -
99
-
100
-
101
-
102
-
103
-
104
-
105
-
106
-
107
-
108
-
109
-
110
-
111
-
112
-
113
-
114
-
115
-
116
-
117
-
118
-
119
-
120
-
121
-
122
-
123
-
124
-
125
-
126
-
127
-
128
-
129
-
130
-
131
-
132
-
133
-
134
-
135
-
136
-
137
 |
 |
THE DIRECTV GROUP, INC.
NOTES TO THE CONSOLIDATED FINANCIAL STATEMENTS — (continued)
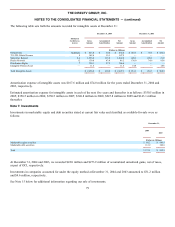
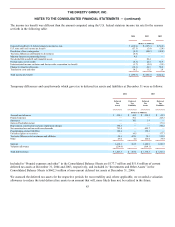
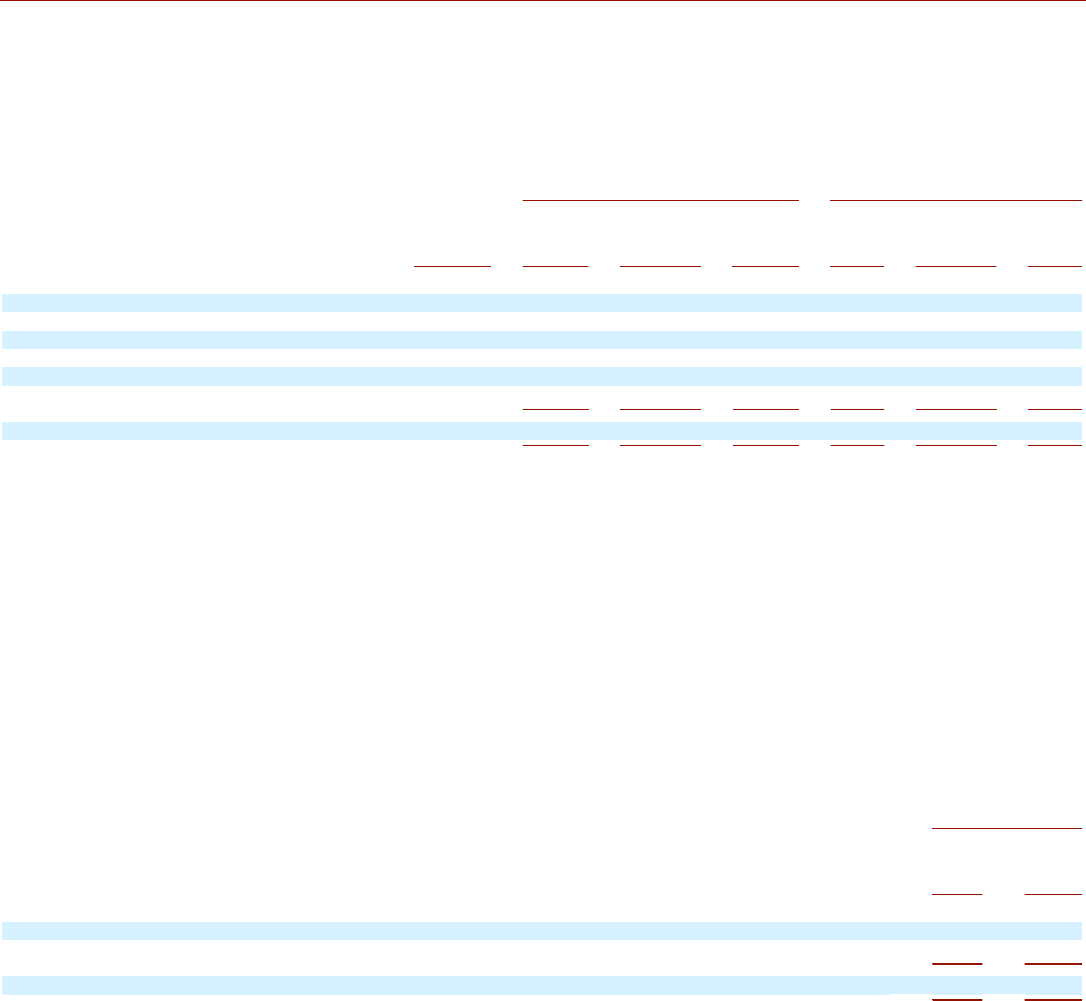
The following table sets forth the amounts recorded for intangible assets at December 31:
December 31, 2004
December 31, 2003
Estimated
Useful Lives
(years)
Gross
Amount
Accumulated
Amortization
Net
Amount
Gross
Amount
Accumulated
Amortization
Net
Amount
(Dollars in Millions)
Orbital Slots
Indefinite
$
463.0
$
30.6
$
432.4
$
463.0
$
30.6
$
432.4
72.5 WL Orbital License
4
162.6
15.1
147.5
—
—
—
Subscriber Related
2-6
1,556.8
313.9
1,242.9
220.0
198.1
21.9
Dealer Network
12
130.0
43.8
86.2
130.0
34.6
95.4
Distribution Rights
7
334.1
27.5
306.6
—
—
—
Intangible Pension Asset
—
11.5
—
11.5
18.8
—
18.8
Total Intangible Assets
$
2,658.0
$
430.9
$
2,227.1
$
831.8
$
263.3
$
568.5
Amortization expense of intangible assets was $167.6 million and $74.0 million for the years ended December 31, 2004 and
2003, respectively.
Estimated amortization expense for intangible assets in each of the next five years and thereafter is as follows: $350.5 million in
2005; $350.5 million in 2006; $350.5 million in 2007; $340.8 million in 2008; $247.8 million in 2009 and $143.1 million
thereafter.
Note 7: Investments
Investments in marketable equity and debt securities stated at current fair value and classified as available-for-sale were as
follows:
December 31,
2004
2003
(Dollars in Millions)
Marketable equity securities
$
60.2
$
486.9
Marketable debt securities
112.9
108.6
Total
$
173.1
$
595.5
At December 31, 2004 and 2003, we recorded $22.0 million and $273.9 million of accumulated unrealized gains, net of taxes,
as part of OCI, respectively.
Investments in companies accounted for under the equity method at December 31, 2004 and 2003 amounted to $31.2 million
and $4.6 million, respectively.
See Note 15 below for additional information regarding our sale of investments.
79