DIRECTV 2004 Annual Report Download - page 92
Download and view the complete annual report
Please find page 92 of the 2004 DIRECTV annual report below. You can navigate through the pages in the report by either clicking on the pages listed below, or by using the keyword search tool below to find specific information within the annual report.-
 1
1 -
2
-
3
-
4
-
5
-
6
-
7
-
8
-
9
-
10
-
11
-
12
-
13
-
14
-
15
-
16
-
17
-
18
-
19
-
20
-
21
-
22
-
23
-
24
-
25
-
26
-
27
-
28
-
29
-
30
-
31
-
32
-
33
-
34
-
35
-
36
-
37
-
38
-
39
-
40
-
41
-
42
-
43
-
44
-
45
-
46
-
47
-
48
-
49
-
50
-
51
-
52
-
53
-
54
-
55
-
56
-
57
-
58
-
59
-
60
-
61
-
62
-
63
-
64
-
65
-
66
-
67
-
68
-
69
-
70
-
71
-
72
-
73
-
74
-
75
-
76
-
77
-
78
-
79
-
80
-
81
-
 82
82 -
 83
83 -
 84
84 -
 85
85 -
 86
86 -
 87
87 -
 88
88 -
 89
89 -
 90
90 -
 91
91 -
 92
92 -
 93
93 -
 94
94 -
 95
95 -
 96
96 -
 97
97 -
 98
98 -
 99
99 -
 100
100 -
 101
101 -
 102
102 -
103
-
104
-
105
-
106
-
107
-
108
-
109
-
110
-
111
-
112
-
113
-
114
-
115
-
116
-
117
-
118
-
119
-
120
-
121
-
122
-
123
-
124
-
125
-
126
-
127
-
128
-
129
-
130
-
131
-
132
-
133
-
134
-
135
-
136
-
137
 |
 |

THE DIRECTV GROUP, INC.
NOTES TO THE CONSOLIDATED FINANCIAL STATEMENTS — (continued)
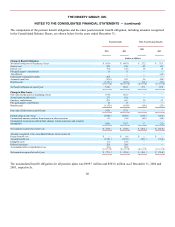
The income tax benefit was different than the amount computed using the U.S. federal statutory income tax rate for the reasons
set forth in the following table:
2004
2003
2002
(Dollars in Millions)
Expected benefit at U.S. federal statutory income tax rate
$
(616.0
)
$
(167.2
)
$
(54.4
)
U.S. state and local income tax benefit
(57.5
)
(2.9
)
(2.4
)
Resolution of tax contingencies
(0.4
)
(48.0
)
(98.0
)
Tax basis differences attributable to divestitures
(8.9
)
—
—
Minority interests in partnership losses
4.6
—
—
Non-deductible goodwill and intangible assets
—
20.4
—
Foreign taxes, net of credits
(6.3
)
22.4
55.9
Extraterritorial income exclusion and foreign sales corporation tax benefit
(1.7
)
(2.8
)
(3.5
)
Change in valuation allowance
(14.6
)
62.3
58.6
Transaction costs and other
10.2
11.5
1.6
Total income tax benefit
$
(690.6
)
$
(104.3
)
$
(42.2
)
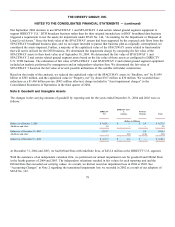
Temporary differences and carryforwards which gave rise to deferred tax assets and liabilities at December 31 were as follows:
2004
2003
Deferred
Tax
Assets
Deferred
Tax
Liabilities
Deferred
Tax
Assets
Deferred
Tax
Liabilities
(Dollars in Millions)
Accruals and advances
$
254.3
$
44.5
$
299.5
$
43.3
Prepaid expenses
—
36.1
—
225.3
State taxes
—
38.5
1.4
—
Gain on PanAmSat merger
—
—
—
171.6
Depreciation, amortization and asset impairment charges
390.3
—
—
360.2
Net operating loss and tax credit carryforwards
753.4
—
645.7
—
Programming contract liabilities
144.4
—
150.1
—
Unrealized gains on securities
—
14.5
—
177.7
Tax basis differences in investments and affiliates
28.9
423.5
78.1
323.5
Other
47.0
6.4
166.0
39.9
Subtotal
1,618.3
563.5
1,340.8
1,341.5
Valuation allowance
(214.6
)
—
(164.1
)
—
Total deferred taxes
$
1,403.7
$
563.5
$
1,176.7
$
1,341.5
Included in “Prepaid expenses and other” in the Consolidated Balance Sheets are $177.7 million and $51.8 million of current
deferred tax assets at December 31, 2004 and 2003, respectively, and included in “Investments and Other Assets” in the
Consolidated Balance Sheets is $662.5 million of non-current deferred tax assets at December 31, 2004.
We assessed the deferred tax assets for the respective periods for recoverability and, where applicable, we recorded a valuation
allowance to reduce the total deferred tax assets to an amount that will, more likely than not, be realized in the future.
83