DIRECTV 2004 Annual Report Download - page 107
Download and view the complete annual report
Please find page 107 of the 2004 DIRECTV annual report below. You can navigate through the pages in the report by either clicking on the pages listed below, or by using the keyword search tool below to find specific information within the annual report.-
 1
1 -
2
-
3
-
4
-
5
-
6
-
7
-
8
-
9
-
10
-
11
-
12
-
13
-
14
-
15
-
16
-
17
-
18
-
19
-
20
-
21
-
22
-
23
-
24
-
25
-
26
-
27
-
28
-
29
-
30
-
31
-
32
-
33
-
34
-
35
-
36
-
37
-
38
-
39
-
40
-
41
-
42
-
43
-
44
-
45
-
46
-
47
-
48
-
49
-
50
-
51
-
52
-
53
-
54
-
55
-
56
-
57
-
58
-
59
-
60
-
61
-
62
-
63
-
64
-
65
-
66
-
67
-
68
-
69
-
70
-
71
-
72
-
73
-
74
-
75
-
76
-
77
-
78
-
79
-
80
-
81
-
82
-
83
-
84
-
85
-
86
-
87
-
88
-
89
-
90
-
91
-
92
-
93
-
94
-
95
-
96
-
 97
97 -
 98
98 -
 99
99 -
 100
100 -
 101
101 -
 102
102 -
 103
103 -
 104
104 -
 105
105 -
 106
106 -
 107
107 -
 108
108 -
 109
109 -
 110
110 -
 111
111 -
 112
112 -
 113
113 -
 114
114 -
 115
115 -
 116
116 -
 117
117 -
118
-
119
-
120
-
121
-
122
-
123
-
124
-
125
-
126
-
127
-
128
-
129
-
130
-
131
-
132
-
133
-
134
-
135
-
136
-
137
 |
 |
THE DIRECTV GROUP, INC.
NOTES TO THE CONSOLIDATED FINANCIAL STATEMENTS — (continued)
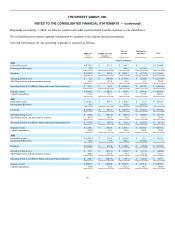
Beginning on January 1, 2004, we allocate pension and other postretirement benefit expenses to our subsidiaries.
We reclassified prior period segment information to conform to the current period presentation.
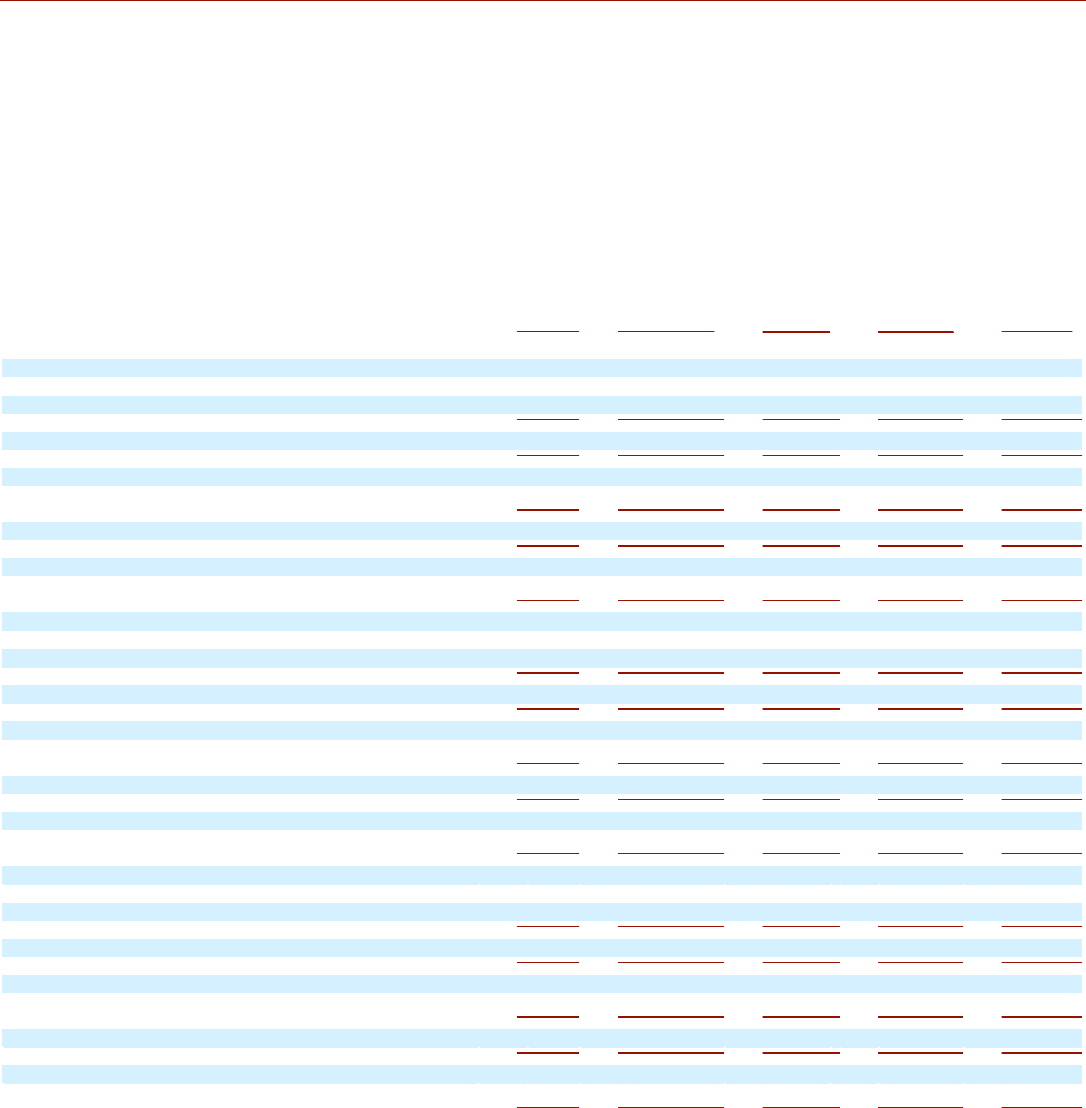
Selected information for our operating segments is reported as follows:
DIRECTV
U. S.
DIRECTV Latin
America
Network
Systems
Eliminations
and Other
Total
(Dollars in Millions)
2004
External Revenues
$
9,738.1
$
675.2
$
946.7
$
—
$
11,360.0
Intersegment Revenues
25.8
—
152.4
(178.2
)
—
Revenues
$
9,763.9
$
675.2
$
1,099.1
$
(178.2
)
$
11,360.0
Operating Profit (Loss)
$
21.9
$
(142.0
)
$
(1,778.5
)
$
(220.8
)
$
(2,119.4
)
Add: Depreciation and amortization expense
561.2
187.9
95.6
(6.7
)
838.0
Operating Profit (Loss) Before Depreciation and Amortization(1)
$
583.1
$
45.9
$
(1,682.9
)
$
(227.5
)
$
(1,281.4
)
Segment Assets
$
8,994.2
$
1,086.7
$
696.9
$
3,546.6
$
14,324.4
Capital Expenditures
671.5
81.7
132.1
137.8
1,023.1
2003
External Revenues
$
7,654.1
$
597.7
$
1,105.2
$
15.2
$
9,372.2
Intersegment Revenues
41.5
—
165.8
(207.3
)
—
Revenues
$
7,695.6
$
597.7
$
1,271.0
$
(192.1
)
$
9,372.2
Operating Profit (Loss)
$
458.8
$
(284.6
)
$
(103.4
)
$
(208.3
)
$
(137.5
)
Add: Depreciation and amortization expense
497.0
199.3
70.8
(12.2
)
754.9
Operating Profit (Loss) Before Depreciation and Amortization(1)
$
955.8
$
(85.3
)
$
(32.6
)
$
(220.5
)
$
617.4
Segment Assets
$
7,285.2
$
682.9
$
2,555.3
$
8,514.0
$
19,037.4
Capital Expenditures
389.0
57.9
159.6
140.9
747.4
2002
External Revenues
$
6,418.2
$
679.3
$
1,035.8
$
52.1
$
8,185.4
Intersegment Revenues
26.4
0.3
104.2
(130.9
)
—
Revenues
$
6,444.6
$
679.6
$
1,140.0
$
(78.8
)
$
8,185.4
Operating Profit (Loss)
$
192.7
$
(415.1
)
$
(169.8
)
$
(17.4
)
$
(409.6
)
Add: Depreciation and amortization expense
405.6
213.2
70.1
(12.2
)
676.7
Operating Profit (Loss) Before Depreciation and Amortization(1)
$
598.3
$
(201.9
)
$
(99.7
)
$
(29.6
)
$
267.1
Segment Assets
$
8,007.2
$
1,080.8
$
2,526.9
$
6,371.8
$
17,986.7
Capital Expenditures
375.0
95.0
397.8
86.7
954.5
98