DIRECTV 2004 Annual Report Download - page 4
Download and view the complete annual report
Please find page 4 of the 2004 DIRECTV annual report below. You can navigate through the pages in the report by either clicking on the pages listed below, or by using the keyword search tool below to find specific information within the annual report.-
 1
1 -
 2
2 -
 3
3 -
 4
4 -
 5
5 -
 6
6 -
 7
7 -
 8
8 -
 9
9 -
 10
10 -
 11
11 -
 12
12 -
 13
13 -
 14
14 -
 15
15 -
16
-
17
-
18
-
19
-
20
-
21
-
22
-
23
-
24
-
25
-
26
-
27
-
28
-
29
-
30
-
31
-
32
-
33
-
34
-
35
-
36
-
37
-
38
-
39
-
40
-
41
-
42
-
43
-
44
-
45
-
46
-
47
-
48
-
49
-
50
-
51
-
52
-
53
-
54
-
55
-
56
-
57
-
58
-
59
-
60
-
61
-
62
-
63
-
64
-
65
-
66
-
67
-
68
-
69
-
70
-
71
-
72
-
73
-
74
-
75
-
76
-
77
-
78
-
79
-
80
-
81
-
82
-
83
-
84
-
85
-
86
-
87
-
88
-
89
-
90
-
91
-
92
-
93
-
94
-
95
-
96
-
97
-
98
-
99
-
100
-
101
-
102
-
103
-
104
-
105
-
106
-
107
-
108
-
109
-
110
-
111
-
112
-
113
-
114
-
115
-
116
-
117
-
118
-
119
-
120
-
121
-
122
-
123
-
124
-
125
-
126
-
127
-
128
-
129
-
130
-
131
-
132
-
133
-
134
-
135
-
136
-
137
 |
 |

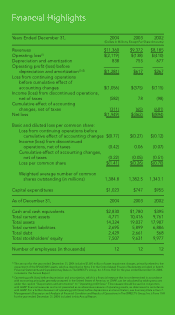
Years Ended December 31, 2004 2003 2002
(Dollars in Millions, Except Per Share Amounts)
Revenues $11,360 $9,372 $8,185
Operating loss
(1)
$(2,119) $(138) $(410)
Depreciation and amortization 838 755 677
Operating profi t (loss) before
depreciation and amortization
(1) (2)
$(1,281) $617 $267
Loss from continuing operations
before cumulative effect of
accounting changes $(1,056) $(375) $(115)
Income (loss) from discontinued operations,
net of taxes (582) 78 (98)
Cumulative effect of accounting
changes, net of taxes (311) (65) (681)
Net loss $(1,949) $(362) $(894)
Basic and diluted loss per common share:
Loss from continuing operations before
cumulative effect of accounting changes $(0.77) $(0.27) $(0.12)
Income (loss) from discontinued
operations, net of taxes (0.42) 0.06 (0.07)
Cumulative effect of accounting changes,
net of taxes (0.22) (0.05) (0.51)
Loss per common share $(1.41) $(0.26) $(0.70)
Weighted average number of common
shares outstanding (in millions) 1,384.8 1,382.5 1,343.1
Capital expenditures $1,023 $747 $955
As of December 31, 2004 2003 2002
Cash and cash equivalents $2,830 $1,780 $395
Total current assets 4,771 10,416 9,761
Total assets 14,324 19,037 17,987
Total current liabilities 2,695 5,899 6,886
Total debt 2,429 2,661 568
Total stockholders’ equity 7,507 9,631 9,977
Number of employees (in thousands) 12 12 12
(1)
The amount for the year ended December 31, 2004 includes $1,693 million of asset impairment charges, primarily related to the
impairment of the SPACEWAY assets, which is described in Note 5 to the Consolidated Financial Statements included in Item 8,
Financial Statements and Supplementary Data in The DIRECTV Group, Inc.’s Form 10-K for the year ended December 31, 2004,
included in this Annual Report
(2)
Operating profi t (loss) before depreciation and amortization, which is a fi nancial measure that is not determined in accordance
with accounting principles generally accepted in the United States of America, or GAAP, can be calculated by adding amounts
under the caption “Depreciation and amortization” to “Operating profi t (loss).” This measure should be used in conjunction
with GAAP fi nancial measures and is not presented as an alternative measure of operating results, as determined in accordance
with GAAP. For a further discussion of operating profi t (loss) before depreciation and amortization, see Summary Data in Item 7.
Management’s Discussion and Analysis of Financial Condition and Results of Operations in The DIRECTV Group, Inc.’s Form 10-K
for the year ended December 31, 2004, included in this Annual Report.
Financial Highlights
$(1,281) $617 $267
$(1,281) $617 $267
$(1,281) $617 $267
changes, net of taxes (311) (65) (681)
changes, net of taxes (311) (65) (681)
changes, net of taxes (311) (65) (681)
Net loss $(1,949) $(362) $(894)
Net loss $(1,949) $(362) $(894)
Net loss $(1,949) $(362) $(894)
Loss per common share $(1.41) $(0.26) $(0.70)
Loss per common share $(1.41) $(0.26) $(0.70)
Loss per common share $(1.41) $(0.26) $(0.70)