DIRECTV 2004 Annual Report Download - page 43
Download and view the complete annual report
Please find page 43 of the 2004 DIRECTV annual report below. You can navigate through the pages in the report by either clicking on the pages listed below, or by using the keyword search tool below to find specific information within the annual report.-
 1
1 -
2
-
3
-
4
-
5
-
6
-
7
-
8
-
9
-
10
-
11
-
12
-
13
-
14
-
15
-
16
-
17
-
18
-
19
-
20
-
21
-
22
-
23
-
24
-
25
-
26
-
27
-
28
-
29
-
30
-
31
-
32
-
 33
33 -
 34
34 -
 35
35 -
 36
36 -
 37
37 -
 38
38 -
 39
39 -
 40
40 -
 41
41 -
 42
42 -
 43
43 -
 44
44 -
 45
45 -
 46
46 -
 47
47 -
 48
48 -
 49
49 -
 50
50 -
 51
51 -
 52
52 -
 53
53 -
54
-
55
-
56
-
57
-
58
-
59
-
60
-
61
-
62
-
63
-
64
-
65
-
66
-
67
-
68
-
69
-
70
-
71
-
72
-
73
-
74
-
75
-
76
-
77
-
78
-
79
-
80
-
81
-
82
-
83
-
84
-
85
-
86
-
87
-
88
-
89
-
90
-
91
-
92
-
93
-
94
-
95
-
96
-
97
-
98
-
99
-
100
-
101
-
102
-
103
-
104
-
105
-
106
-
107
-
108
-
109
-
110
-
111
-
112
-
113
-
114
-
115
-
116
-
117
-
118
-
119
-
120
-
121
-
122
-
123
-
124
-
125
-
126
-
127
-
128
-
129
-
130
-
131
-
132
-
133
-
134
-
135
-
136
-
137
 |
 |

THE DIRECTV GROUP, INC.
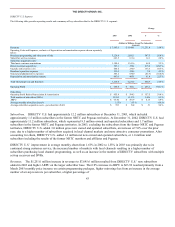
manage churn through improved marketing, upgrade and retention efforts in the former NRTC and Pegasus territories.
DIRECTV U.S.’ ARPU increased 4.7% in 2004 and 6.9% in 2003. DIRECTV U.S. expects the percentage increase in ARPU
for 2005 to be fairly consistent with the 2004 increase due mostly to its planned programming package price increases in the
first half of 2005.
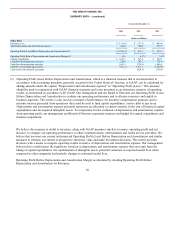
Operating Costs and Expenses. Operating costs and expenses as a percentage of revenues increased from 94% in 2003 to
100% in 2004 due to higher subscriber acquisition costs resulting from an increase in gross subscriber additions and higher
upgrade and retention costs. DIRECTV U.S. expects operating costs and expenses as a percentage of revenue to improve in
2005 due to the expected higher revenues on its growing subscriber base, partially offset by higher depreciation and
amortization expense and slightly higher subscriber acquisition, upgrade and retention costs. DIRECTV U.S. expects increases
in subscriber acquisition, upgrade and retention costs due to an expected increase in the number of set-top receivers and DVRs
per subscriber, partially offset by lower set-top receiver costs. However, increases above the levels DIRECTV U.S.’ expects
could have a negative effect on its results of operations.
Cash Flows. DIRECTV U.S. expects cash flows, which we define as net cash provided by (used in) operating activities plus
cash provided by (used in) investing activities, in 2005 to be slightly above break even since the higher cash provided by
operating activities will be mostly offset by higher capital expenditures for satellites and broadcast equipment to support the
launch of new local and HDTV channels, to replace existing satellites and to provide backup for existing satellites.
2004 Compared To 2003
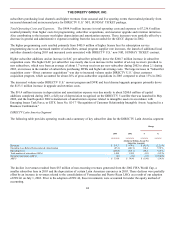
Consolidated Results of Operations
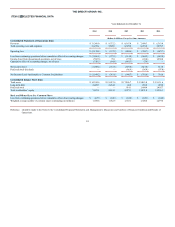
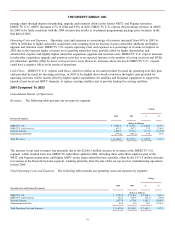
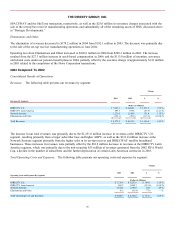
Revenues. The following table presents our revenues by segment:
Change
Revenues By Segment:
2004
2003
$
%
(Dollars in Millions)
DIRECTV U.S.
$
9,763.9
$
7,695.6
$
2,068.3
26.9
%
DIRECTV Latin America
675.2
597.7
77.5
13.0
%
Network Systems
1,099.1
1,271.0
(171.9
)
(13.5
)%
Eliminations and Other
(178.2
)
(192.1
)
13.9
7.2
%
Total Revenues
$
11,360.0
$
9,372.2
$
1,987.8
21.2
%
The increase in our total revenues was primarily due to the $2,068.3 million increase in revenues at the DIRECTV U.S.
segment, which resulted from new DIRECTV subscribers added in 2004, including those subscribers added as part of the
NRTC and Pegasus transactions, and higher ARPU on the larger subscriber base, partially offset by the $171.9 million decrease
in revenues at the Network Systems segment, resulting primarily from the sale of the set-top receiver manufacturing operations
in June 2004.
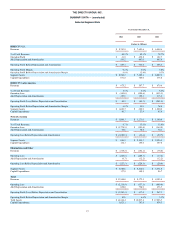
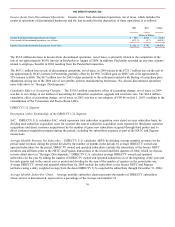
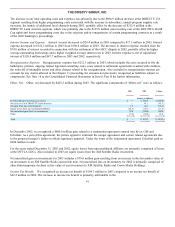
Total Operating Costs and Expenses. The following table presents our operating costs and expenses by segment:
Change
Operating Costs and Expenses By Segment:
2004
2003
$
%
(Dollars in Millions)
DIRECTV U.S.
$
9,742.0
$
7,236.8
$
2,505.2
34.6
%
DIRECTV Latin America
817.2
882.3
(65.1
)
(7.4
)%
Network Systems
2,877.6
1,374.4
1,503.2
109.4
%
Eliminations and Other
42.6
16.2
26.4
163.0
%
Total Operating Costs and Expenses
$
13,479.4
$
9,509.7
$
3,969.7
41.7
%
34