DIRECTV 2004 Annual Report Download - page 46
Download and view the complete annual report
Please find page 46 of the 2004 DIRECTV annual report below. You can navigate through the pages in the report by either clicking on the pages listed below, or by using the keyword search tool below to find specific information within the annual report.-
 1
1 -
2
-
3
-
4
-
5
-
6
-
7
-
8
-
9
-
10
-
11
-
12
-
13
-
14
-
15
-
16
-
17
-
18
-
19
-
20
-
21
-
22
-
23
-
24
-
25
-
26
-
27
-
28
-
29
-
30
-
31
-
32
-
33
-
34
-
35
-
 36
36 -
 37
37 -
 38
38 -
 39
39 -
 40
40 -
 41
41 -
 42
42 -
 43
43 -
 44
44 -
 45
45 -
 46
46 -
 47
47 -
 48
48 -
 49
49 -
 50
50 -
 51
51 -
 52
52 -
 53
53 -
 54
54 -
 55
55 -
 56
56 -
57
-
58
-
59
-
60
-
61
-
62
-
63
-
64
-
65
-
66
-
67
-
68
-
69
-
70
-
71
-
72
-
73
-
74
-
75
-
76
-
77
-
78
-
79
-
80
-
81
-
82
-
83
-
84
-
85
-
86
-
87
-
88
-
89
-
90
-
91
-
92
-
93
-
94
-
95
-
96
-
97
-
98
-
99
-
100
-
101
-
102
-
103
-
104
-
105
-
106
-
107
-
108
-
109
-
110
-
111
-
112
-
113
-
114
-
115
-
116
-
117
-
118
-
119
-
120
-
121
-
122
-
123
-
124
-
125
-
126
-
127
-
128
-
129
-
130
-
131
-
132
-
133
-
134
-
135
-
136
-
137
 |
 |

THE DIRECTV GROUP, INC.
DIRECTV subscribers. DIRECTV U.S. calculates average monthly subscriber churn by dividing the average monthly number
of disconnected DIRECTV subscribers for the period (total subscribers disconnected during the period divided by the number of
months in the period) by average DIRECTV subscribers for the period. Average monthly churn includes the results from the
former NRTC and Pegasus subscribers.
Subscriber Count. The total number of DIRECTV subscribers represents the total number of subscribers actively subscribing
to the DIRECTV service, including the subscribers of the NRTC’s members and affiliates, seasonal subscribers and subscribers
who are in the process of relocating.
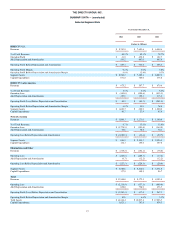
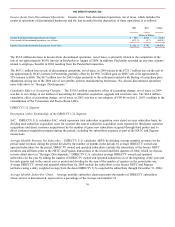
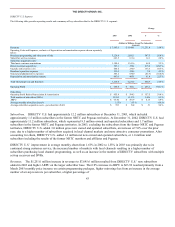
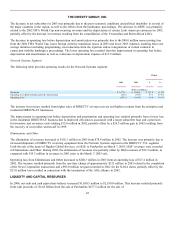
The following table provides operating results and a summary of key subscriber data for the DIRECTV U.S. segment:
Change
2004
2003
$
%
(Dollars in Millions, Except Per Subscriber
Amounts)
Revenues
$
9,763.9
$
7,695.6
$
2,068.3
26.9
%
Operating Costs and Expenses, exclusive of depreciation and amortization expense shown separately
below:
Broadcast programming and other costs of sale
4,010.5
3,229.8
780.7
24.2
%
Subscriber service expenses
740.2
623.5
116.7
18.7
%
Subscriber acquisition costs:
Third party customer acquisitions
1,960.8
1,388.4
572.4
41.2
%
Direct customer acquisitions
684.1
395.1
289.0
73.1
%
Upgrade and retention costs
993.2
404.4
588.8
145.6
%
Broadcast operations expenses
129.7
133.4
(3.7
)
(2.8
)%
General and administrative expenses
662.3
565.2
97.1
17.2
%
Depreciation and amortization expense
561.2
497.0
64.2
12.9
%
Total Operating Costs and Expenses
9,742.0
7,236.8
2,505.2
34.6
%
Operating Profit
$
21.9
$
458.8
$
(436.9
)
(95.2
)%
Other Data:
Operating Profit Before Depreciation & Amortization
$
583.1
$
955.8
$
(372.7
)
(39.0
)%
Total number of subscribers (000’s)
13,940
12,212
1,728
14.2
%
ARPU
$
66.95
$
63.92
$
3.03
4.7
%
Average monthly subscriber churn %
1.59
%
1.55
%
—
2.6
%
Average subscriber acquisition costs—per subscriber (SAC)
$
643
$
593
$
50
8.4
%
Subscribers. DIRECTV U.S. had approximately 13.9 million subscribers at December 31, 2004, which included
approximately 1.4 million subscribers in the former NRTC and Pegasus territories that DIRECTV U.S. acquired in the second
and third quarters of 2004. At December 31, 2003, DIRECTV U.S. had approximately 12.2 million subscribers, which
represented 10.7 million owned and operated subscribers and 1.5 million subscribers in the former NRTC and Pegasus
territories. In 2004, excluding the subscribers from the former NRTC and Pegasus territories, DIRECTV U.S. added 4.0 million
gross new owned and operated subscribers, an increase of 34% over the prior year, due to a higher number of subscribers
acquired in local channel markets, more attractive consumer promotions, and an improved and more diverse distribution
network. After accounting for churn, DIRECTV U.S. added 1.8 million net new owned and operated subscribers, or 1.7 million
total subscribers including the results of the former NRTC members and affiliates and Pegasus during 2004.
DIRECTV U.S.’ average monthly subscriber churn increased to 1.59% for the year ended December 31, 2004 compared to
average monthly subscriber churn of 1.55% for the year ended December 31, 2003 primarily
37