DIRECTV 2004 Annual Report Download - page 45
Download and view the complete annual report
Please find page 45 of the 2004 DIRECTV annual report below. You can navigate through the pages in the report by either clicking on the pages listed below, or by using the keyword search tool below to find specific information within the annual report.-
 1
1 -
2
-
3
-
4
-
5
-
6
-
7
-
8
-
9
-
10
-
11
-
12
-
13
-
14
-
15
-
16
-
17
-
18
-
19
-
20
-
21
-
22
-
23
-
24
-
25
-
26
-
27
-
28
-
29
-
30
-
31
-
32
-
33
-
34
-
 35
35 -
 36
36 -
 37
37 -
 38
38 -
 39
39 -
 40
40 -
 41
41 -
 42
42 -
 43
43 -
 44
44 -
 45
45 -
 46
46 -
 47
47 -
 48
48 -
 49
49 -
 50
50 -
 51
51 -
 52
52 -
 53
53 -
 54
54 -
 55
55 -
56
-
57
-
58
-
59
-
60
-
61
-
62
-
63
-
64
-
65
-
66
-
67
-
68
-
69
-
70
-
71
-
72
-
73
-
74
-
75
-
76
-
77
-
78
-
79
-
80
-
81
-
82
-
83
-
84
-
85
-
86
-
87
-
88
-
89
-
90
-
91
-
92
-
93
-
94
-
95
-
96
-
97
-
98
-
99
-
100
-
101
-
102
-
103
-
104
-
105
-
106
-
107
-
108
-
109
-
110
-
111
-
112
-
113
-
114
-
115
-
116
-
117
-
118
-
119
-
120
-
121
-
122
-
123
-
124
-
125
-
126
-
127
-
128
-
129
-
130
-
131
-
132
-
133
-
134
-
135
-
136
-
137
 |
 |

THE DIRECTV GROUP, INC.
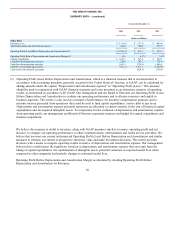
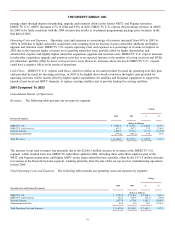
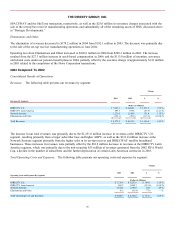
Income (Loss) from Discontinued Operations. Income (loss) from discontinued operations, net of taxes, which includes the
results of operations of discontinued businesses and the loss recorded for the disposition of those operations, is as follows:
2004
2003
Change
(Dollars in Millions)
Income from discontinued operations, net of taxes
$
50.8
$
82.8
$
(32.0
)
Loss on sale of discontinued operations, net of taxes
(633.1
)
(4.7
)
(628.4
)
Income (loss) from discontinued operations, net of taxes
$
(582.3
)
$
78.1
$
(660.4
)
The $32.0 million decrease in income from discontinued operations, net of taxes, is primarily related to the completion of the
sale of our approximately 80.4% interest in PanAmSat in August of 2004. In addition, PanAmSat recorded an one-time expense
related to employee benefits in 2004 resulting from the PanAmSat transaction.
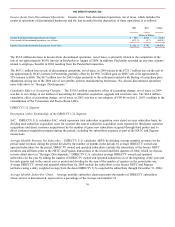
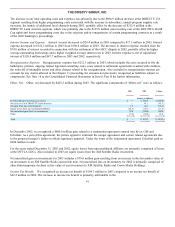
The $633.1 million loss on sale of discontinued operations, net of taxes, in 2004 relates to the $723.7 million loss on the sale of
our approximately 80.4% interest in PanAmSat, partially offset by the $90.7 million gain on HNS’ sale of its approximately
55% interest in HSS. The $4.7 million loss for 2003 relates primarily to the settlement reached with Boeing of a purchase price
adjustment arising out of the 2000 sale of our satellite systems manufacturing businesses. We discuss discontinued operations
more fully above in “Strategic Developments.”
Cumulative Effect of Accounting Changes. The $310.5 million cumulative effect of accounting change, net of taxes, in 2004
was due to our change in our method of accounting for subscriber acquisition, upgrade and retention costs. The $64.6 million
cumulative effect of accounting change, net of taxes, in 2003 was due to our adoption of FIN 46 on July 1, 2003, resulting in the
consolidation of the Venezuelan and Puerto Rican LOCs.
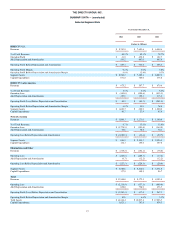
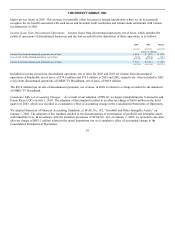
DIRECTV U.S. Segment
Description of Key Terminology of the DIRECTV U.S. Segment
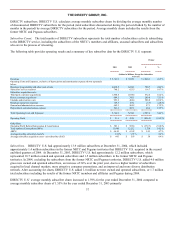
SAC. DIRECTV U.S. calculates SAC, which represents total subscriber acquisition costs stated on a per subscriber basis, by
dividing total subscriber acquisition costs for a period (the sum of subscriber acquisition costs reported for third party customer
acquisitions and direct customer acquisitions) by the number of gross new subscribers acquired through third parties and its
direct customer acquisition program during the period, excluding the subscribers acquired as part of the NRTC and Pegasus
transactions.
Average Monthly Revenue Per Subscriber. DIRECTV U.S. calculates ARPU by dividing average monthly revenues for the
period (total revenues during the period divided by the number of months in the period) by average DIRECTV owned and
operated subscribers for the period. DIRECTV owned and operated subscribers exclude the subscribers of the former NRTC
members and affiliates prior to the NRTC and Pegasus transactions in the second and third quarters of 2004, which we discuss
in more detail above in “Strategic Developments.” DIRECTV U.S. calculates average DIRECTV owned and operated
subscribers for the year by adding the number of DIRECTV owned and operated subscribers as of the beginning of the year and
for each quarter end in the current year or period and dividing by the sum of the number of quarters in the period plus one.
Average DIRECTV owned and operated subscribers for 2004 include the subscribers in the former NRTC and Pegasus
territories using a daily weighted average from the dates DIRECTV U.S. acquired the subscribers through December 31, 2004.
Average Monthly Subscriber Churn. Average monthly subscriber churn represents the number of DIRECTV subscribers
whose service is disconnected, expressed as a percentage of the average total number of
36