DIRECTV 2004 Annual Report Download - page 53
Download and view the complete annual report
Please find page 53 of the 2004 DIRECTV annual report below. You can navigate through the pages in the report by either clicking on the pages listed below, or by using the keyword search tool below to find specific information within the annual report.-
 1
1 -
2
-
3
-
4
-
5
-
6
-
7
-
8
-
9
-
10
-
11
-
12
-
13
-
14
-
15
-
16
-
17
-
18
-
19
-
20
-
21
-
22
-
23
-
24
-
25
-
26
-
27
-
28
-
29
-
30
-
31
-
32
-
33
-
34
-
35
-
36
-
37
-
38
-
39
-
40
-
41
-
42
-
 43
43 -
 44
44 -
 45
45 -
 46
46 -
 47
47 -
 48
48 -
 49
49 -
 50
50 -
 51
51 -
 52
52 -
 53
53 -
 54
54 -
 55
55 -
 56
56 -
 57
57 -
 58
58 -
 59
59 -
 60
60 -
 61
61 -
 62
62 -
 63
63 -
64
-
65
-
66
-
67
-
68
-
69
-
70
-
71
-
72
-
73
-
74
-
75
-
76
-
77
-
78
-
79
-
80
-
81
-
82
-
83
-
84
-
85
-
86
-
87
-
88
-
89
-
90
-
91
-
92
-
93
-
94
-
95
-
96
-
97
-
98
-
99
-
100
-
101
-
102
-
103
-
104
-
105
-
106
-
107
-
108
-
109
-
110
-
111
-
112
-
113
-
114
-
115
-
116
-
117
-
118
-
119
-
120
-
121
-
122
-
123
-
124
-
125
-
126
-
127
-
128
-
129
-
130
-
131
-
132
-
133
-
134
-
135
-
136
-
137
 |
 |

THE DIRECTV GROUP, INC.
subscribers purchasing local channels and higher revenues from seasonal and live sporting events that resulted primarily from
increased demand and an increased price for DIRECTV U.S.’ NFL SUNDAY TICKET package.
Total Operating Costs and Expenses. The $984.9 million increase in total operating costs and expenses to $7,236.8 million
resulted primarily from higher costs for programming, subscriber acquisitions, and customer upgrade and retention initiatives.
Also contributing to the increase was higher depreciation and amortization expense. These increases were partially offset by a
decrease in general and administrative expenses resulting from the loss recorded for the GECC dispute in 2002.
The higher programming costs resulted primarily from $405.9 million of higher license fees for subscription service
programming due to an increased number of subscribers, annual program supplier rate increases, the launch of additional local
and other channels during 2003 and increased costs associated with DIRECTV U.S.’ new NFL SUNDAY TICKET contract.
Higher subscriber additions and an increase in SAC per subscriber primarily drove the $260.7 million increase in subscriber
acquisition costs. The higher SAC per subscriber was mostly due to an increase in the number of set-top receivers provided to
new subscribers, which rose from an average of about 1.7 set-top receivers per new subscriber during 2002 to about 2.1 during
2003, an increase in the number of subscribers purchasing DVRs and higher advertising costs. The large increase in “Subscriber
acquisition costs—Direct customer acquisitions” was due to increased volume under DIRECTV U.S.’ direct customer
acquisition program, which accounted for about 24% of gross subscriber acquisitions in 2003 compared to about 13% in 2002.
The increased volume under DIRECTV U.S.’ movers program and DVR and local channel upgrade programs primarily drove
the $133.5 million increase in upgrade and retention costs.
The $91.4 million increase in depreciation and amortization expense was due mostly to about $200.0 million of capital
additions completed during 2003, a full year of depreciation recognized on the DIRECTV 5 satellite that was launched in May
2002, and the fourth quarter 2002 reinstatement of amortization expense related to intangible assets in accordance with
Emerging Issues Task Force, or EITF, Issue No. 02-17 “Recognition of Customer Relationship Intangible Assets Acquired in a
Business Combination.”
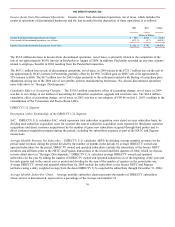
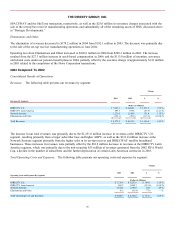
DIRECTV Latin America Segment
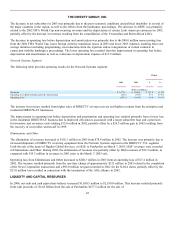
The following table provides operating results and a summary of key subscriber data for the DIRECTV Latin America segment:
Change
2003
2002
$
%
(Dollars in Millions, Except Per
Subscriber Amounts)
Revenues
$
597.7
$
679.6
$
(81.9
)
(12.1
)%
Operating Loss Before Depreciation & Amortization
(85.3
)
(201.9
)
116.6
57.8
%
Operating Loss
(284.6
)
(415.1
)
130.5
31.4
%
Total number of subscribers (000’s)
1,499
1,582
(83
)
(5.2
)%
Net subscriber losses (000’s)
(83
)
(28
)
(55
)
(196.4
)%
ARPU
$
33.00
$
34.90
$
(1.90
)
(5.4
)%
The decline in revenues resulted from $55 million of non-recurring revenues generated from the 2002 FIFA World Cup, a
smaller subscriber base in 2003 and the depreciation of certain Latin American currencies in 2003. These declines were partially
offset by an increase in revenues related to the consolidation of Venezuelan and Puerto Rican LOCs as a result of our adoption
of FIN 46 on July 1, 2003. Prior to the adoption of FIN 46, these investments were accounted for under the equity method of
accounting.
44