Burger King 2013 Annual Report Download - page 97
Download and view the complete annual report
Please find page 97 of the 2013 Burger King annual report below. You can navigate through the pages in the report by either clicking on the pages listed below, or by using the keyword search tool below to find specific information within the annual report.-
 1
1 -
2
-
3
-
4
-
5
-
6
-
7
-
8
-
9
-
10
-
11
-
12
-
13
-
14
-
15
-
16
-
17
-
18
-
19
-
20
-
21
-
22
-
23
-
24
-
25
-
26
-
27
-
28
-
29
-
30
-
31
-
32
-
33
-
34
-
35
-
36
-
37
-
38
-
39
-
40
-
41
-
42
-
43
-
44
-
45
-
46
-
47
-
48
-
49
-
50
-
51
-
52
-
53
-
54
-
55
-
56
-
57
-
58
-
59
-
60
-
61
-
62
-
63
-
64
-
65
-
66
-
67
-
68
-
69
-
70
-
71
-
72
-
73
-
74
-
75
-
76
-
77
-
78
-
79
-
80
-
81
-
82
-
83
-
84
-
85
-
86
-
 87
87 -
 88
88 -
 89
89 -
 90
90 -
 91
91 -
 92
92 -
 93
93 -
 94
94 -
 95
95 -
 96
96 -
 97
97 -
 98
98 -
 99
99 -
 100
100 -
 101
101 -
 102
102 -
 103
103 -
 104
104 -
 105
105 -
 106
106 -
 107
107 -
108
-
109
-
110
-
111
-
112
-
113
-
114
-
115
-
116
-
117
-
118
-
119
-
120
-
121
-
122
-
123
-
124
-
125
-
126
-
127
-
128
-
129
-
130
-
131
-
132
-
133
-
134
-
135
-
136
-
137
-
138
-
139
-
140
-
141
-
142
-
143
-
144
-
145
-
146
-
147
-
148
-
149
-
150
-
151
-
152
-
153
-
154
-
155
-
156
-
157
-
158
-
159
-
160
-
161
-
162
-
163
-
164
-
165
-
166
-
167
-
168
-
169
-
170
-
171
-
172
-
173
-
174
-
175
-
176
-
177
-
178
-
179
-
180
-
181
-
182
-
183
-
184
-
185
-
186
-
187
-
188
-
189
-
190
-
191
-
192
-
193
-
194
-
195
-
196
-
197
-
198
-
199
-
200
-
201
-
202
-
203
-
204
-
205
-
206
-
207
-
208
-
209
-
210
-
211
 |
 |

Table of Contents
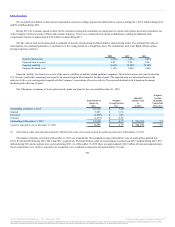
At December 31, 2013 and December 31, 2012, the fair value of our variable rate term debt and bonds was estimated at $3.1 billion, compared to a
carrying amount of $2.9 billion, net of original issuance discount. Fair value of variable rate term debt was estimated using inputs based on bid and offer
prices and are Level 2 inputs within the fair value hierarchy. Fair value of the Senior Notes and Discount Notes was estimated using quoted market prices and
are Level 1 inputs within the fair value hierarchy.
Certain nonfinancial assets and liabilities are measured at fair value on a nonrecurring basis. These assets and liabilities are not measured at fair value
on an ongoing basis but are subject to periodic impairment tests. These items primarily include long-lived assets, goodwill, the Brand and other intangible
assets. Refer to Note 2 for inputs and valuation techniques used to measure fair value of these nonfinancial assets.
With respect to our assets held for sale recorded at fair value, the fair value measurements are typically based on binding purchase prices from acquirers
of Company restaurants that we plan to refranchise. In certain cases, our corporate development team may develop fair value estimates for assets held for sale
for which there is no binding purchase price. These fair value measurements, which are based on Level 3 inputs, and changes in fair value measurements are
reviewed and assessed each quarter for assets classified as held for sale by our corporate development team. Our corporate development team utilizes its
knowledge of the FFHR industry and historical experience in refranchising transactions in establishing the valuation process, which is generally based on a
market approach. Under the market approach, our corporate development team uses transaction prices for refranchisings that were recently completed,
adjusting where necessary for factors specific to the assets held for sale.
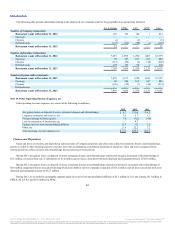
At December 31, 2012, assets held for sale totaled $23.9 million and consisted primarily of goodwill and machinery and equipment to be sold in
connection with refranchisings. We did not have assets classified as held for sale at December 31, 2013. Assets held for sale are included with Prepaids and
Other Current Assets, net in our consolidated balance sheets.
We assess the fair value less costs to sell of assets held for sale each reporting period they remain classified as held for sale. We report subsequent
changes in the fair value less costs to sell of assets held for sale as an adjustment to the carrying amount of the assets held for sale. However, the adjusted
carrying amount cannot exceed the carrying amount of the long-lived asset at the time it was initially classified as held for sale. During 2012, we recorded
impairment losses of $13.2 million associated with long-lived assets for Company restaurants we classified as held for sale in the U.S. We did not record any
impairment charges associated with assets held for sale during 2013 and 2011.
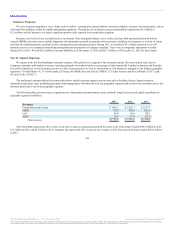
We enter into derivative instruments for risk management purposes, including derivatives designated as cash flow hedges, derivatives designated as net
investment hedges and those utilized as economic hedges. We use derivatives to manage exposure to fluctuations in interest rates and currency exchange rates.
See Note 13 for fair value measurements of our derivative instruments.
We have entered into interest rate cap agreements to manage interest rate risk. Such agreements cap the borrowing rate on variable debt to provide a hedge
against the risk of rising rates. At December 31, 2013 and December 31, 2012, we had interest rate cap agreements (notional amount of $1.2 billion and
$1.4 billion, respectively) (the “Cap Agreements”) to mitigate the impact of fluctuations in the three-month LIBOR and effectively cap the LIBOR applicable to
our variable rate debt at a weighted-average rate of 1.75%. The six year Cap Agreements are a series of individual caplets that reset and settle quarterly through
October 19, 2016 consistent with the payment dates of our LIBOR-based term debt.
During 2012, we terminated our Euro denominated interest rate cap agreements which effectively capped the annual interest expense applicable to our
borrowings under the 2011 Amended Credit Agreement for Euro denominated borrowings. In connection with the termination of the Euro denominated interest
rate cap agreements, we recorded a charge of $8.4 million in 2012 within other operating (income) expense, net related to realized losses reclassified from
accumulated other comprehensive income (loss) (“AOCI”).
Under the terms of the Cap Agreements, if LIBOR resets above a strike price, we will receive the net difference between LIBOR and the strike price. We
have elected our applicable rate per annum as Eurocurrency rate determined by reference to LIBOR. In addition, on the quarterly settlement dates, we will remit
the deferred premium payment (plus interest) to the counterparty, whether LIBOR resets above or below the strike price.
95
Source: Burger King Worldwide, Inc., 10-K, February 21, 2014 Powered by Morningstar® Document Research℠
The information contained herein may not be copied, adapted or distributed and is not warranted to be accurate, complete or timely. The user assumes all risks for any damages or losses arising from any use of this
information, except to the extent such damages or losses cannot be limited or excluded by applicable law. Past financial performance is no guarantee of future results.