Burger King 2013 Annual Report Download - page 67
Download and view the complete annual report
Please find page 67 of the 2013 Burger King annual report below. You can navigate through the pages in the report by either clicking on the pages listed below, or by using the keyword search tool below to find specific information within the annual report.-
 1
1 -
2
-
3
-
4
-
5
-
6
-
7
-
8
-
9
-
10
-
11
-
12
-
13
-
14
-
15
-
16
-
17
-
18
-
19
-
20
-
21
-
22
-
23
-
24
-
25
-
26
-
27
-
28
-
29
-
30
-
31
-
32
-
33
-
34
-
35
-
36
-
37
-
38
-
39
-
40
-
41
-
42
-
43
-
44
-
45
-
46
-
47
-
48
-
49
-
50
-
51
-
52
-
53
-
54
-
55
-
56
-
 57
57 -
 58
58 -
 59
59 -
 60
60 -
 61
61 -
 62
62 -
 63
63 -
 64
64 -
 65
65 -
 66
66 -
 67
67 -
 68
68 -
 69
69 -
 70
70 -
 71
71 -
 72
72 -
 73
73 -
 74
74 -
 75
75 -
 76
76 -
 77
77 -
78
-
79
-
80
-
81
-
82
-
83
-
84
-
85
-
86
-
87
-
88
-
89
-
90
-
91
-
92
-
93
-
94
-
95
-
96
-
97
-
98
-
99
-
100
-
101
-
102
-
103
-
104
-
105
-
106
-
107
-
108
-
109
-
110
-
111
-
112
-
113
-
114
-
115
-
116
-
117
-
118
-
119
-
120
-
121
-
122
-
123
-
124
-
125
-
126
-
127
-
128
-
129
-
130
-
131
-
132
-
133
-
134
-
135
-
136
-
137
-
138
-
139
-
140
-
141
-
142
-
143
-
144
-
145
-
146
-
147
-
148
-
149
-
150
-
151
-
152
-
153
-
154
-
155
-
156
-
157
-
158
-
159
-
160
-
161
-
162
-
163
-
164
-
165
-
166
-
167
-
168
-
169
-
170
-
171
-
172
-
173
-
174
-
175
-
176
-
177
-
178
-
179
-
180
-
181
-
182
-
183
-
184
-
185
-
186
-
187
-
188
-
189
-
190
-
191
-
192
-
193
-
194
-
195
-
196
-
197
-
198
-
199
-
200
-
201
-
202
-
203
-
204
-
205
-
206
-
207
-
208
-
209
-
210
-
211
 |
 |

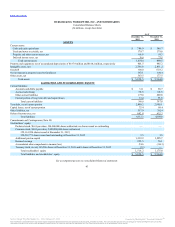
Table of Contents
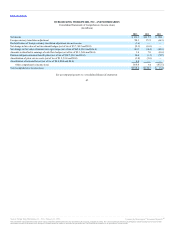
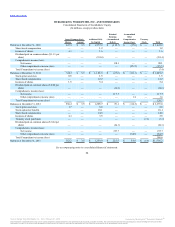
Consolidated Statements of Cash Flows
(In millions)
Net income $ 233.7 $ 117.7 $ 88.1
Adjustments to reconcile net income to net cash provided by operating activities:
Depreciation and amortization 65.8 114.2 136.4
Loss on early extinguishment of debt — 34.2 21.1
Amortization of deferred financing costs and debt issuance discount 56.3 57.0 46.3
Equity in net loss from unconsolidated affiliates 12.7 4.1 1.2
Loss (gain) on remeasurement of foreign denominated transactions 0.3 (8.2) 0.4
Amortization of defined benefit pension and postretirement items (2.1) (2.5) —
Realized loss on terminated caps/swaps 6.1 11.8 0.5
Net (gains) losses on refranchisings and dispositions of assets (3.9) 27.0 (1.0)
Impairment on non-restaurant properties — — 2.3
Bad debt expense (recoveries), net 2.0 (0.8) 6.1
Share-based compensation expense 14.8 12.2 1.2
Deferred income taxes 32.1 8.9 (27.3)
Changes in current assets and liabilities, excluding acquisitions and dispositions:
Trade and notes receivable (7.6) (22.2) (6.0)
Prepaids and other current assets (7.8) (7.0) 105.5
Accounts and drafts payable (30.6) (23.9) 8.7
Accrued advertising (10.6) (32.3) 18.3
Other accrued liabilities (5.4) (40.3) 21.2
Other long-term assets and liabilities (30.6) (25.5) (16.8)
Net cash provided by operating activities 325.2 224.4 406.2
Payments for property and equipment (25.5) (70.2) (82.1)
Proceeds from refranchisings, disposition of assets and restaurant closures 64.8 104.9 29.9
Investments in / advances to unconsolidated affiliates — — (4.5)
Payments for acquired franchisee operations, net of cash acquired (11.9) (15.3) —
Return of investment on direct financing leases 15.4 14.2 14.6
Other investing activities 0.2 — 0.7
Net cash provided by (used for) investing activities 43.0 33.6 (41.4)
Proceeds from term debt — 1,733.5 1,860.0
Proceeds from Discount Notes — — 401.5
Repayments of term debt and capital leases (57.2) (1,766.8) (1,874.5)
Extinguishment of debt — (112.8) (70.6)
Payment of financing costs — (16.0) (32.6)
Dividends paid on common stock (84.3) (14.0) (393.4)
Proceeds from stock option exercises 6.0 1.5 —
Excess tax benefits from share-based compensation 10.1 — —
Proceeds from issuance of shares — — 1.6
Repurchases of common stock (7.3) — —
Net cash used for financing activities (132.7) (174.6) (108.0)
Effect of exchange rates on cash and cash equivalents 4.7 4.3 (4.8)
Increase in cash and cash equivalents 240.2 87.7 252.0
Cash and cash equivalents at beginning of period 546.7 459.0 207.0
$786.9 $546.7 $ 459.0
Interest paid $ 139.1 $170.3 $183.0
Income taxes paid $35.6 $40.1 $26.2
Investments in unconsolidated affiliates $ 17.8 $98.6 $ —
Acquisition of property with capital lease obligations $1.0 $ 36.1 $3.2
Net investment in direct financing leases $ — $0.7 $ 14.6
See accompanying notes to consolidated financial statements.
65
Source: Burger King Worldwide, Inc., 10-K, February 21, 2014 Powered by Morningstar® Document Research℠
The information contained herein may not be copied, adapted or distributed and is not warranted to be accurate, complete or timely. The user assumes all risks for any damages or losses arising from any use of this
information, except to the extent such damages or losses cannot be limited or excluded by applicable law. Past financial performance is no guarantee of future results.