Burger King 2013 Annual Report Download - page 106
Download and view the complete annual report
Please find page 106 of the 2013 Burger King annual report below. You can navigate through the pages in the report by either clicking on the pages listed below, or by using the keyword search tool below to find specific information within the annual report.-
 1
1 -
2
-
3
-
4
-
5
-
6
-
7
-
8
-
9
-
10
-
11
-
12
-
13
-
14
-
15
-
16
-
17
-
18
-
19
-
20
-
21
-
22
-
23
-
24
-
25
-
26
-
27
-
28
-
29
-
30
-
31
-
32
-
33
-
34
-
35
-
36
-
37
-
38
-
39
-
40
-
41
-
42
-
43
-
44
-
45
-
46
-
47
-
48
-
49
-
50
-
51
-
52
-
53
-
54
-
55
-
56
-
57
-
58
-
59
-
60
-
61
-
62
-
63
-
64
-
65
-
66
-
67
-
68
-
69
-
70
-
71
-
72
-
73
-
74
-
75
-
76
-
77
-
78
-
79
-
80
-
81
-
82
-
83
-
84
-
85
-
86
-
87
-
88
-
89
-
90
-
91
-
92
-
93
-
94
-
95
-
 96
96 -
 97
97 -
 98
98 -
 99
99 -
 100
100 -
 101
101 -
 102
102 -
 103
103 -
 104
104 -
 105
105 -
 106
106 -
 107
107 -
 108
108 -
 109
109 -
 110
110 -
 111
111 -
 112
112 -
 113
113 -
 114
114 -
 115
115 -
 116
116 -
117
-
118
-
119
-
120
-
121
-
122
-
123
-
124
-
125
-
126
-
127
-
128
-
129
-
130
-
131
-
132
-
133
-
134
-
135
-
136
-
137
-
138
-
139
-
140
-
141
-
142
-
143
-
144
-
145
-
146
-
147
-
148
-
149
-
150
-
151
-
152
-
153
-
154
-
155
-
156
-
157
-
158
-
159
-
160
-
161
-
162
-
163
-
164
-
165
-
166
-
167
-
168
-
169
-
170
-
171
-
172
-
173
-
174
-
175
-
176
-
177
-
178
-
179
-
180
-
181
-
182
-
183
-
184
-
185
-
186
-
187
-
188
-
189
-
190
-
191
-
192
-
193
-
194
-
195
-
196
-
197
-
198
-
199
-
200
-
201
-
202
-
203
-
204
-
205
-
206
-
207
-
208
-
209
-
210
-
211
 |
 |

Table of Contents
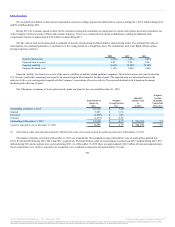
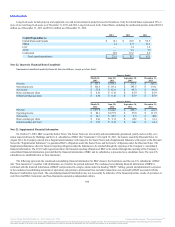
We carry insurance programs to cover claims such as workers’ compensation, general liability, automotive liability, executive risk and property, and are
self-insured for healthcare claims for eligible participating employees. Through the use of insurance program deductibles (ranging from $0.1 million to
$2.5 million) and self insurance, we retain a significant portion of the expected losses under these programs.
Insurance reserves have been recorded based on our estimate of the anticipated ultimate costs to settle all claims, both reported and incurred-but-not-
reported (IBNR), and such reserves include judgments and independent actuarial assumptions about economic conditions, the frequency or severity of claims
and claim development patterns, and claim reserve, management and settlement practices. During 2012, we recorded a $4.1 million reduction in our self
insurance reserve as we completed refranchising transactions and operated fewer Company restaurants. There were no comparable adjustments recorded
during 2013 or 2011. We had $19.2 million in accrued liabilities as of December 31, 2013 and $26.7 million as of December 31, 2012 for these claims.
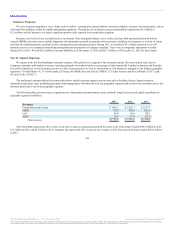
We operate in the fast food hamburger restaurant category of the quick service segment of the restaurant industry. Revenues include retail sales at
Company restaurants and franchise revenues, consisting primarily of royalties based on a percentage of sales reported by franchise restaurants and franchise
fees paid by franchisees as well as property income we derive from properties we lease to our franchisees. Our business is managed in four distinct geographic
segments: (1) United States (“U.S.”) and Canada; (2) Europe, the Middle East and Africa (“EMEA”); (3) Latin America and the Caribbean (“LAC”); and
(4) Asia Pacific (“APAC”).
The unallocated amounts reflected in certain tables below include corporate support costs in areas such as facilities, finance, human resources,
information technology, legal, marketing and supply chain management, which benefit all of our geographic segments and system-wide restaurants and are not
allocated specifically to any of the geographic segments.
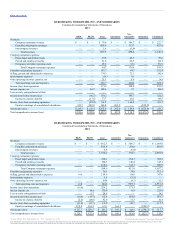
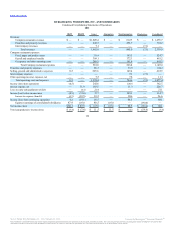
The following tables present revenues, segment income, depreciation and amortization, assets, goodwill, long-lived assets and capital expenditures by
geographic segment (in millions):
United States and Canada $ 665.2 $1,265.7 $ 1,573.3
EMEA 335.8 472.9 525.6
LAC 86.8 134.4 128.1
APAC 58.5 97.9 112.9
Total revenues $1,146.3 $1,970.9 $2,339.9
The United States represented 10% or more of our total revenues in each period presented. Revenues in the United States totaled $604.4 million in 2013,
$1.1 billion in 2012, and $1.4 billion in 2011. Germany also represented 10% or more of our revenues in 2012. Revenues in Germany totaled $219.2 million
in 2012.
104
Source: Burger King Worldwide, Inc., 10-K, February 21, 2014 Powered by Morningstar® Document Research℠
The information contained herein may not be copied, adapted or distributed and is not warranted to be accurate, complete or timely. The user assumes all risks for any damages or losses arising from any use of this
information, except to the extent such damages or losses cannot be limited or excluded by applicable law. Past financial performance is no guarantee of future results.