Burger King 2013 Annual Report Download - page 104
Download and view the complete annual report
Please find page 104 of the 2013 Burger King annual report below. You can navigate through the pages in the report by either clicking on the pages listed below, or by using the keyword search tool below to find specific information within the annual report.-
 1
1 -
2
-
3
-
4
-
5
-
6
-
7
-
8
-
9
-
10
-
11
-
12
-
13
-
14
-
15
-
16
-
17
-
18
-
19
-
20
-
21
-
22
-
23
-
24
-
25
-
26
-
27
-
28
-
29
-
30
-
31
-
32
-
33
-
34
-
35
-
36
-
37
-
38
-
39
-
40
-
41
-
42
-
43
-
44
-
45
-
46
-
47
-
48
-
49
-
50
-
51
-
52
-
53
-
54
-
55
-
56
-
57
-
58
-
59
-
60
-
61
-
62
-
63
-
64
-
65
-
66
-
67
-
68
-
69
-
70
-
71
-
72
-
73
-
74
-
75
-
76
-
77
-
78
-
79
-
80
-
81
-
82
-
83
-
84
-
85
-
86
-
87
-
88
-
89
-
90
-
91
-
92
-
93
-
 94
94 -
 95
95 -
 96
96 -
 97
97 -
 98
98 -
 99
99 -
 100
100 -
 101
101 -
 102
102 -
 103
103 -
 104
104 -
 105
105 -
 106
106 -
 107
107 -
 108
108 -
 109
109 -
 110
110 -
 111
111 -
 112
112 -
 113
113 -
 114
114 -
115
-
116
-
117
-
118
-
119
-
120
-
121
-
122
-
123
-
124
-
125
-
126
-
127
-
128
-
129
-
130
-
131
-
132
-
133
-
134
-
135
-
136
-
137
-
138
-
139
-
140
-
141
-
142
-
143
-
144
-
145
-
146
-
147
-
148
-
149
-
150
-
151
-
152
-
153
-
154
-
155
-
156
-
157
-
158
-
159
-
160
-
161
-
162
-
163
-
164
-
165
-
166
-
167
-
168
-
169
-
170
-
171
-
172
-
173
-
174
-
175
-
176
-
177
-
178
-
179
-
180
-
181
-
182
-
183
-
184
-
185
-
186
-
187
-
188
-
189
-
190
-
191
-
192
-
193
-
194
-
195
-
196
-
197
-
198
-
199
-
200
-
201
-
202
-
203
-
204
-
205
-
206
-
207
-
208
-
209
-
210
-
211
 |
 |

Table of Contents
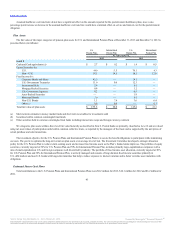
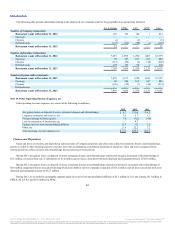
The following table presents information relating to the analysis of our restaurant count for the geographic areas and periods indicated.
183 132 100 3 418
Openings — — — — —
Closures (4) — (2) — (6)
Refranchisings (127) (132) (98) (3) (360)
52 — — — 52
7,293 2,989 1,290 1,007 12,579
Openings 81 387 167 247 882
Closures (117) (58) (5) (26) (206)
Refranchisings 127 132 98 3 360
7,384 3,450 1,550 1,231 13,615
7,476 3,121 1,390 1,010 12,997
Openings 80 388 167 247 882
Closures (120) (59) (7) (26) (212)
Refranchisings — — — — —
7,436 3,450 1,550 1,231 13,667
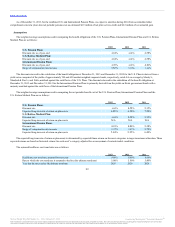
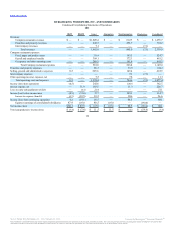
Other operating (income) expenses, net, consist of the following (in millions):
Net (gains) losses on disposal of assets, restaurant closures and refranchisings $ 0.7 $ 30.8 $ 6.2
Litigation settlements and reserves, net 7.6 1.7 1.3
Foreign exchange net losses (gains) 7.4 (4.2) (4.6)
Loss on termination of interest rate cap — 8.7 —
Equity in net loss from unconsolidated affiliates 12.7 4.1 1.2
Other, net 5.6 12.2 7.2
Other operating (income) expenses, net $34.0 $53.3 $11.3
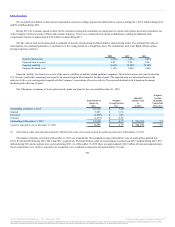
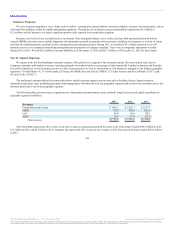
Gains and losses on closures and dispositions represent sales of Company properties and other costs related to restaurant closures and refranchisings,
and are recorded in other operating expenses (income), net in the accompanying consolidated statements of operations. Gains and losses recognized in the
current period may reflect closures and refranchisings that occurred in previous periods.
During 2013, net (gains) losses on disposal of assets, restaurant closures and refranchisings consisted of net gains associated with refranchisings of
$5.3 million, net losses from sale of subsidiaries of $1.0 million and net losses associated with asset disposals and restaurant closures of $5.0 million.
During 2012, net (gains) losses on disposal of assets, restaurant closures and refranchisings consisted of net losses associated with refranchisings of
$4.9 million, impairment losses associated with long-lived assets held for sale for Company restaurants of $13.2 million and net losses associated with asset
disposals and restaurant closures of $12.7 million.
During 2013, we recorded by geographic segment equity in net loss from unconsolidated affiliates of $5.5 million in U.S. and Canada, $0.3 million in
EMEA, $0 in LAC and $6.9 million in APAC.
102
Source: Burger King Worldwide, Inc., 10-K, February 21, 2014 Powered by Morningstar® Document Research℠
The information contained herein may not be copied, adapted or distributed and is not warranted to be accurate, complete or timely. The user assumes all risks for any damages or losses arising from any use of this
information, except to the extent such damages or losses cannot be limited or excluded by applicable law. Past financial performance is no guarantee of future results.