Burger King 2013 Annual Report Download - page 107
Download and view the complete annual report
Please find page 107 of the 2013 Burger King annual report below. You can navigate through the pages in the report by either clicking on the pages listed below, or by using the keyword search tool below to find specific information within the annual report.-
 1
1 -
2
-
3
-
4
-
5
-
6
-
7
-
8
-
9
-
10
-
11
-
12
-
13
-
14
-
15
-
16
-
17
-
18
-
19
-
20
-
21
-
22
-
23
-
24
-
25
-
26
-
27
-
28
-
29
-
30
-
31
-
32
-
33
-
34
-
35
-
36
-
37
-
38
-
39
-
40
-
41
-
42
-
43
-
44
-
45
-
46
-
47
-
48
-
49
-
50
-
51
-
52
-
53
-
54
-
55
-
56
-
57
-
58
-
59
-
60
-
61
-
62
-
63
-
64
-
65
-
66
-
67
-
68
-
69
-
70
-
71
-
72
-
73
-
74
-
75
-
76
-
77
-
78
-
79
-
80
-
81
-
82
-
83
-
84
-
85
-
86
-
87
-
88
-
89
-
90
-
91
-
92
-
93
-
94
-
95
-
96
-
 97
97 -
 98
98 -
 99
99 -
 100
100 -
 101
101 -
 102
102 -
 103
103 -
 104
104 -
 105
105 -
 106
106 -
 107
107 -
 108
108 -
 109
109 -
 110
110 -
 111
111 -
 112
112 -
 113
113 -
 114
114 -
 115
115 -
 116
116 -
 117
117 -
118
-
119
-
120
-
121
-
122
-
123
-
124
-
125
-
126
-
127
-
128
-
129
-
130
-
131
-
132
-
133
-
134
-
135
-
136
-
137
-
138
-
139
-
140
-
141
-
142
-
143
-
144
-
145
-
146
-
147
-
148
-
149
-
150
-
151
-
152
-
153
-
154
-
155
-
156
-
157
-
158
-
159
-
160
-
161
-
162
-
163
-
164
-
165
-
166
-
167
-
168
-
169
-
170
-
171
-
172
-
173
-
174
-
175
-
176
-
177
-
178
-
179
-
180
-
181
-
182
-
183
-
184
-
185
-
186
-
187
-
188
-
189
-
190
-
191
-
192
-
193
-
194
-
195
-
196
-
197
-
198
-
199
-
200
-
201
-
202
-
203
-
204
-
205
-
206
-
207
-
208
-
209
-
210
-
211
 |
 |

Table of Contents
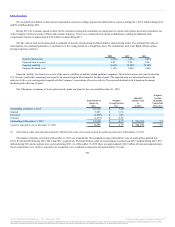
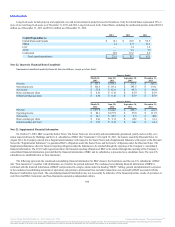
Our measure of segment income is adjusted EBITDA. Adjusted EBITDA represents earnings before interest, taxes, depreciation and amortization,
adjusted to exclude specifically identified items that management believes do not directly reflect our core operations and assists management in comparing
segment performance by removing the impact of certain items that management believes do not reflect our core operations. A reconciliation of segment income to
net income consists of the following:
U.S. and Canada $ 436.7 $ 447.0 $ 436.6
EMEA 189.4 166.1 146.0
LAC 67.7 73.2 63.9
APAC 49.3 41.1 26.7
Total 743.1 727.4 673.2
Unallocated Management G&A (77.5) (75.3) (88.2)
Adjusted EBITDA 665.6 652.1 585.0
Share-based compensation and non-cash incentive compensation expense 17.6 10.2 6.4
Global portfolio realignment project costs 26.2 30.2 7.6
Business combination agreement expenses — 27.0 —
Field optimization project costs — — 10.6
Global restructuring and related professional fees — — 46.5
2010 Transaction costs — — 3.7
Other operating (income) expenses, net 34.0 53.3 11.3
EBITDA 587.8 531.4 498.9
Depreciation and amortization 65.6 113.7 136.4
Income from operations 522.2 417.7 362.5
Interest expense, net 200.0 223.8 226.7
Loss on early extinguishment of debt — 34.2 21.1
Income tax expense 88.5 42.0 26.6
Net income $233.7 $117.7 $ 88.1
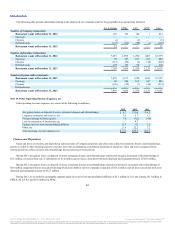
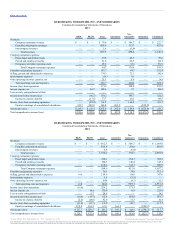
United States and Canada $ 41.5 $ 68.8 $ 86.2
EMEA 11.1 17.9 22.6
LAC 0.7 6.0 6.7
APAC 2.4 5.7 7.6
Unallocated 9.9 15.3 13.3
Total depreciation and amortization $65.6 $113.7 $136.4
United States and Canada $ 3,718.4 $ 3,472.5 $ 230.9 $ 231.0 $ 875.4 $ 938.6
EMEA 1,449.9 1,383.9 207.9 201.6 28.2 55.3
LAC 152.3 189.9 128.7 124.1 4.6 20.0
APAC 439.7 459.3 62.5 62.5 0.3 0.4
Unallocated 68.2 58.4 — — 56.1 51.3
Total $5,828.5 $5,564.0 $630.0 $619.2 $964.6 $1,065.6
105
Source: Burger King Worldwide, Inc., 10-K, February 21, 2014 Powered by Morningstar® Document Research℠
The information contained herein may not be copied, adapted or distributed and is not warranted to be accurate, complete or timely. The user assumes all risks for any damages or losses arising from any use of this
information, except to the extent such damages or losses cannot be limited or excluded by applicable law. Past financial performance is no guarantee of future results.