Burger King 2013 Annual Report Download - page 39
Download and view the complete annual report
Please find page 39 of the 2013 Burger King annual report below. You can navigate through the pages in the report by either clicking on the pages listed below, or by using the keyword search tool below to find specific information within the annual report.-
 1
1 -
2
-
3
-
4
-
5
-
6
-
7
-
8
-
9
-
10
-
11
-
12
-
13
-
14
-
15
-
16
-
17
-
18
-
19
-
20
-
21
-
22
-
23
-
24
-
25
-
26
-
27
-
28
-
 29
29 -
 30
30 -
 31
31 -
 32
32 -
 33
33 -
 34
34 -
 35
35 -
 36
36 -
 37
37 -
 38
38 -
 39
39 -
 40
40 -
 41
41 -
 42
42 -
 43
43 -
 44
44 -
 45
45 -
 46
46 -
 47
47 -
 48
48 -
 49
49 -
50
-
51
-
52
-
53
-
54
-
55
-
56
-
57
-
58
-
59
-
60
-
61
-
62
-
63
-
64
-
65
-
66
-
67
-
68
-
69
-
70
-
71
-
72
-
73
-
74
-
75
-
76
-
77
-
78
-
79
-
80
-
81
-
82
-
83
-
84
-
85
-
86
-
87
-
88
-
89
-
90
-
91
-
92
-
93
-
94
-
95
-
96
-
97
-
98
-
99
-
100
-
101
-
102
-
103
-
104
-
105
-
106
-
107
-
108
-
109
-
110
-
111
-
112
-
113
-
114
-
115
-
116
-
117
-
118
-
119
-
120
-
121
-
122
-
123
-
124
-
125
-
126
-
127
-
128
-
129
-
130
-
131
-
132
-
133
-
134
-
135
-
136
-
137
-
138
-
139
-
140
-
141
-
142
-
143
-
144
-
145
-
146
-
147
-
148
-
149
-
150
-
151
-
152
-
153
-
154
-
155
-
156
-
157
-
158
-
159
-
160
-
161
-
162
-
163
-
164
-
165
-
166
-
167
-
168
-
169
-
170
-
171
-
172
-
173
-
174
-
175
-
176
-
177
-
178
-
179
-
180
-
181
-
182
-
183
-
184
-
185
-
186
-
187
-
188
-
189
-
190
-
191
-
192
-
193
-
194
-
195
-
196
-
197
-
198
-
199
-
200
-
201
-
202
-
203
-
204
-
205
-
206
-
207
-
208
-
209
-
210
-
211
 |
 |

Table of Contents
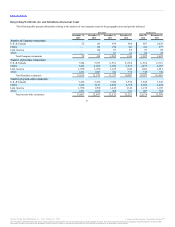
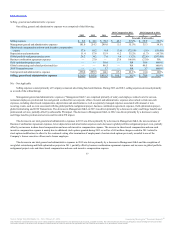
Selling, general and administrative expenses
Our selling, general and administrative expenses were comprised of the following:
Selling expenses $ 6.2 $ 48.3 $ 78.2 $ 42.1 87.2% $ 29.9 38.2%
Management general and administrative expenses 181.0 214.3 249.6 33.3 15.5% 35.3 14.1%
Share-based compensation and non-cash incentive compensation
expense 17.6 10.2 6.4 (7.4) (72.5)% (3.8) (59.4)%
Depreciation and amortization 11.4 17.6 15.9 6.2 35.2% (1.7) (10.7)%
Global portfolio realignment project costs 26.2 30.2 7.6 4.0 13.2% (22.6) (297.4)%
Business combination agreement expenses — 27.0 — 27.0 100.0% (27.0) NA
Field optimization project costs — — 10.6 — NA 10.6 100.0%
Global restructuring and related professional fees — — 46.5 — NA 46.5 100.0%
2010 Transaction costs — — 3.7 — NA 3.7 100.0%
Total general and administrative expenses 236.2 299.3 340.3 63.1 21.1% 41.0 12.0%
$242.4 $347.6 $ 418.5 $ 105.2 30.3% $ 70.9 16.9%
NA – Not Applicable
Selling expenses consist primarily of Company restaurant advertising fund contributions. During 2013 and 2012, selling expenses decreased primarily
as a result of the refranchisings.
Management general and administrative expenses (“Management G&A”) are comprised primarily of salary and employee related costs for our non-
restaurant employees, professional fees and general overhead for our corporate offices. General and administrative expenses also include certain non-cash
expenses, including share-based compensation, depreciation and amortization as well as separately managed expenses associated with unusual or non-
recurring events, such as costs associated with the global portfolio realignment project, business combination agreement expenses, field optimization project,
global restructuring and 2010 Transactions. The decrease in Management G&A in 2013 was driven primarily by a decrease in salary and fringe benefits and
professional services, partially offset by unfavorable FX impact. The decrease in Management G&A in 2012 was driven primarily by a decrease in salary
and fringe benefits, professional services and favorable FX impact.
The decrease in our total general and administrative expenses in 2013 was driven primarily by a decrease in Management G&A, the non-recurrence of
Business Combination Agreement expenses, lower depreciation and amortization expenses and a decrease in global portfolio realignment project costs, partially
offset by an increase in share-based compensation and non-cash incentive compensation expense. The increase in share-based compensation and non-cash
incentive compensation expense is mainly due to additional stock options granted during 2013 as well as a $4.0 million charge recorded in 2013 related to
stock option modifications to allow for the continued vesting after termination of employment of certain stock options previously awarded to one of the
Company’s former executive officers and a former employee.
The decrease in our total general and administrative expenses in 2012 was driven primarily by a decrease in Management G&A and the completion of
our global restructuring and field optimization projects in 2011, partially offset by business combination agreement expenses and increases in global portfolio
realignment project costs and share-based compensation and non-cash incentive compensation expense.
37
Source: Burger King Worldwide, Inc., 10-K, February 21, 2014 Powered by Morningstar® Document Research℠
The information contained herein may not be copied, adapted or distributed and is not warranted to be accurate, complete or timely. The user assumes all risks for any damages or losses arising from any use of this
information, except to the extent such damages or losses cannot be limited or excluded by applicable law. Past financial performance is no guarantee of future results.