Burger King 2013 Annual Report Download - page 66
Download and view the complete annual report
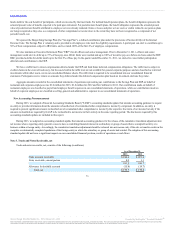
Please find page 66 of the 2013 Burger King annual report below. You can navigate through the pages in the report by either clicking on the pages listed below, or by using the keyword search tool below to find specific information within the annual report.-
 1
1 -
2
-
3
-
4
-
5
-
6
-
7
-
8
-
9
-
10
-
11
-
12
-
13
-
14
-
15
-
16
-
17
-
18
-
19
-
20
-
21
-
22
-
23
-
24
-
25
-
26
-
27
-
28
-
29
-
30
-
31
-
32
-
33
-
34
-
35
-
36
-
37
-
38
-
39
-
40
-
41
-
42
-
43
-
44
-
45
-
46
-
47
-
48
-
49
-
50
-
51
-
52
-
53
-
54
-
55
-
 56
56 -
 57
57 -
 58
58 -
 59
59 -
 60
60 -
 61
61 -
 62
62 -
 63
63 -
 64
64 -
 65
65 -
 66
66 -
 67
67 -
 68
68 -
 69
69 -
 70
70 -
 71
71 -
 72
72 -
 73
73 -
 74
74 -
 75
75 -
 76
76 -
77
-
78
-
79
-
80
-
81
-
82
-
83
-
84
-
85
-
86
-
87
-
88
-
89
-
90
-
91
-
92
-
93
-
94
-
95
-
96
-
97
-
98
-
99
-
100
-
101
-
102
-
103
-
104
-
105
-
106
-
107
-
108
-
109
-
110
-
111
-
112
-
113
-
114
-
115
-
116
-
117
-
118
-
119
-
120
-
121
-
122
-
123
-
124
-
125
-
126
-
127
-
128
-
129
-
130
-
131
-
132
-
133
-
134
-
135
-
136
-
137
-
138
-
139
-
140
-
141
-
142
-
143
-
144
-
145
-
146
-
147
-
148
-
149
-
150
-
151
-
152
-
153
-
154
-
155
-
156
-
157
-
158
-
159
-
160
-
161
-
162
-
163
-
164
-
165
-
166
-
167
-
168
-
169
-
170
-
171
-
172
-
173
-
174
-
175
-
176
-
177
-
178
-
179
-
180
-
181
-
182
-
183
-
184
-
185
-
186
-
187
-
188
-
189
-
190
-
191
-
192
-
193
-
194
-
195
-
196
-
197
-
198
-
199
-
200
-
201
-
202
-
203
-
204
-
205
-
206
-
207
-
208
-
209
-
210
-
211
 |
 |

Table of Contents
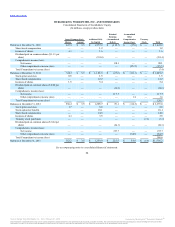
Consolidated Statements of Stockholders’ Equity
(In millions, except per share data)
Balances at December 31, 2010 347.9 $ 3.5 $ 1,577.2 $ (115.7) $ (17.8) $ — $ 1,447.2
Share-based compensation — — 1.2 — — — 1.2
Issuance of shares 0.3 — 1.6 — — — 1.6
Dividend paid on common shares ($ 1.13 per
share) — — (393.4) — — — (393.4)
Comprehensive income (loss):
Net income — — — 88.1 — — 88.1
Other comprehensive income (loss) — — — — (95.5) — (95.5)
Total Comprehensive income (loss) (7.4)
Balances at December 31, 2011 348.2 $ 3.5 $1,186.6 $ (27.6) $(113.3) $ — $ 1,049.2
Stock option exercises 0.5 — 1.5 — — — 1.5
Share-based compensation — — 12.2 — — — 12.2
Issuance of shares 1.5 — 5.4 — — — 5.4
Dividend paid on common shares ($ 0.04 per
share) — — — (14.0) — — (14.0)
Comprehensive income (loss):
Net income — — — 117.7 — — 117.7
Other comprehensive income (loss) — — — — 3.0 — 3.0
Total Comprehensive income (loss) 120.7
Balances at December 31, 2012 350.2 $ 3.5 $1,205.7 $76.1 $(110.3) $ — $1,175.0
Stock option exercises 1.7 — 6.0 — — — 6.0
Stock option tax benefits — — 10.1 — — — 10.1
Share-based compensation — — 14.6 — — — 14.6
Issuance of shares 0.3 — 3.5 — — — 3.5
Treasury stock purchases — — — — — (7.3) (7.3)
Dividend paid on common shares ($ 0.24 per
share) — — — (84.3) — — (84.3)
Comprehensive income (loss):
Net income — — — 233.7 — — 233.7
Other comprehensive income (loss) — — — — 164.9 — 164.9
Total Comprehensive income (loss) 398.6
Balances at December 31, 2013 352.2 $ 3.5 $1,239.9 $225.5 $54.6 $(7.3) $1,516.2
See accompanying notes to consolidated financial statements.
64
Source: Burger King Worldwide, Inc., 10-K, February 21, 2014 Powered by Morningstar® Document Research℠
The information contained herein may not be copied, adapted or distributed and is not warranted to be accurate, complete or timely. The user assumes all risks for any damages or losses arising from any use of this
information, except to the extent such damages or losses cannot be limited or excluded by applicable law. Past financial performance is no guarantee of future results.