Burger King 2013 Annual Report Download - page 78
Download and view the complete annual report
Please find page 78 of the 2013 Burger King annual report below. You can navigate through the pages in the report by either clicking on the pages listed below, or by using the keyword search tool below to find specific information within the annual report.-
 1
1 -
2
-
3
-
4
-
5
-
6
-
7
-
8
-
9
-
10
-
11
-
12
-
13
-
14
-
15
-
16
-
17
-
18
-
19
-
20
-
21
-
22
-
23
-
24
-
25
-
26
-
27
-
28
-
29
-
30
-
31
-
32
-
33
-
34
-
35
-
36
-
37
-
38
-
39
-
40
-
41
-
42
-
43
-
44
-
45
-
46
-
47
-
48
-
49
-
50
-
51
-
52
-
53
-
54
-
55
-
56
-
57
-
58
-
59
-
60
-
61
-
62
-
63
-
64
-
65
-
66
-
67
-
 68
68 -
 69
69 -
 70
70 -
 71
71 -
 72
72 -
 73
73 -
 74
74 -
 75
75 -
 76
76 -
 77
77 -
 78
78 -
 79
79 -
 80
80 -
 81
81 -
 82
82 -
 83
83 -
 84
84 -
 85
85 -
 86
86 -
 87
87 -
 88
88 -
89
-
90
-
91
-
92
-
93
-
94
-
95
-
96
-
97
-
98
-
99
-
100
-
101
-
102
-
103
-
104
-
105
-
106
-
107
-
108
-
109
-
110
-
111
-
112
-
113
-
114
-
115
-
116
-
117
-
118
-
119
-
120
-
121
-
122
-
123
-
124
-
125
-
126
-
127
-
128
-
129
-
130
-
131
-
132
-
133
-
134
-
135
-
136
-
137
-
138
-
139
-
140
-
141
-
142
-
143
-
144
-
145
-
146
-
147
-
148
-
149
-
150
-
151
-
152
-
153
-
154
-
155
-
156
-
157
-
158
-
159
-
160
-
161
-
162
-
163
-
164
-
165
-
166
-
167
-
168
-
169
-
170
-
171
-
172
-
173
-
174
-
175
-
176
-
177
-
178
-
179
-
180
-
181
-
182
-
183
-
184
-
185
-
186
-
187
-
188
-
189
-
190
-
191
-
192
-
193
-
194
-
195
-
196
-
197
-
198
-
199
-
200
-
201
-
202
-
203
-
204
-
205
-
206
-
207
-
208
-
209
-
210
-
211
 |
 |

Table of Contents
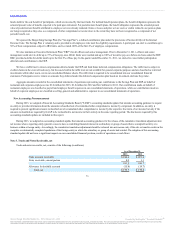
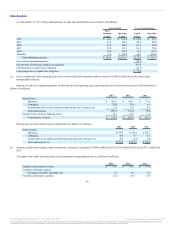
The carrying amount of all our equity method investments was $102.0 million as of December 31, 2013 and $97.3 million as of December 31, 2012
and is included as a component of other assets, net in our consolidated balance sheets. Below are the name of the entities, country of operation and our equity
interest in our significant equity method investments based on the carrying value as of December 31, 2013.
Carrols Restaurant Group, Inc. United States 28.9%
Operadora de Franquicias Alsea S.A.P.I. de C.V. Mexico 20.0%
Pangaea Foods (China) Holdings, Ltd. China 27.5%
The aggregate market value of our equity interest in Carrols Restaurant Group, Inc., based on the quoted market price on December 31, 2013, is
approximately $62.2 million. No quoted market prices are available for our remaining equity method investments.
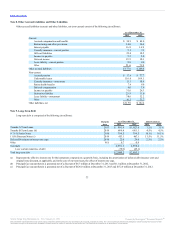
Most of the entities in which we have an equity interest own or franchise Burger King restaurants. Franchise and property revenue we recognized from
franchisees that are owned or franchised by entities in which we have an equity interest consist of the following (in millions):
Revenues from affiliates:
Franchise royalties $57.2 $28.5 $ 4.3
Property revenues 26.3 15.3 —
Franchise fees and other revenue 6.6 4.6 0.7
Total $ 90.1 $48.4 $ 5.0
At December 31, 2013 and December 31, 2012, we had $12.9 million and $10.7 million, respectively, of accounts receivable from our equity method
investments which were recorded in trade and notes receivable, net in our consolidated balance sheets.
76
Source: Burger King Worldwide, Inc., 10-K, February 21, 2014 Powered by Morningstar® Document Research℠
The information contained herein may not be copied, adapted or distributed and is not warranted to be accurate, complete or timely. The user assumes all risks for any damages or losses arising from any use of this
information, except to the extent such damages or losses cannot be limited or excluded by applicable law. Past financial performance is no guarantee of future results.