Burger King 2013 Annual Report Download - page 94
Download and view the complete annual report
Please find page 94 of the 2013 Burger King annual report below. You can navigate through the pages in the report by either clicking on the pages listed below, or by using the keyword search tool below to find specific information within the annual report.-
 1
1 -
2
-
3
-
4
-
5
-
6
-
7
-
8
-
9
-
10
-
11
-
12
-
13
-
14
-
15
-
16
-
17
-
18
-
19
-
20
-
21
-
22
-
23
-
24
-
25
-
26
-
27
-
28
-
29
-
30
-
31
-
32
-
33
-
34
-
35
-
36
-
37
-
38
-
39
-
40
-
41
-
42
-
43
-
44
-
45
-
46
-
47
-
48
-
49
-
50
-
51
-
52
-
53
-
54
-
55
-
56
-
57
-
58
-
59
-
60
-
61
-
62
-
63
-
64
-
65
-
66
-
67
-
68
-
69
-
70
-
71
-
72
-
73
-
74
-
75
-
76
-
77
-
78
-
79
-
80
-
81
-
82
-
83
-
 84
84 -
 85
85 -
 86
86 -
 87
87 -
 88
88 -
 89
89 -
 90
90 -
 91
91 -
 92
92 -
 93
93 -
 94
94 -
 95
95 -
 96
96 -
 97
97 -
 98
98 -
 99
99 -
 100
100 -
 101
101 -
 102
102 -
 103
103 -
 104
104 -
105
-
106
-
107
-
108
-
109
-
110
-
111
-
112
-
113
-
114
-
115
-
116
-
117
-
118
-
119
-
120
-
121
-
122
-
123
-
124
-
125
-
126
-
127
-
128
-
129
-
130
-
131
-
132
-
133
-
134
-
135
-
136
-
137
-
138
-
139
-
140
-
141
-
142
-
143
-
144
-
145
-
146
-
147
-
148
-
149
-
150
-
151
-
152
-
153
-
154
-
155
-
156
-
157
-
158
-
159
-
160
-
161
-
162
-
163
-
164
-
165
-
166
-
167
-
168
-
169
-
170
-
171
-
172
-
173
-
174
-
175
-
176
-
177
-
178
-
179
-
180
-
181
-
182
-
183
-
184
-
185
-
186
-
187
-
188
-
189
-
190
-
191
-
192
-
193
-
194
-
195
-
196
-
197
-
198
-
199
-
200
-
201
-
202
-
203
-
204
-
205
-
206
-
207
-
208
-
209
-
210
-
211
 |
 |

Table of Contents
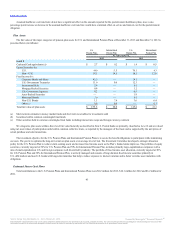
As of December 31, 2013, for the combined U.S. and International Pension Plans, we expect to amortize during 2014 from accumulated other
comprehensive income (loss) into net periodic pension cost an estimated $2.9 million of net prior service credit and $0.2 million of net actuarial gain.
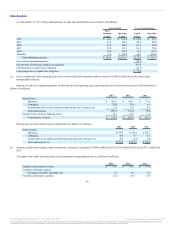
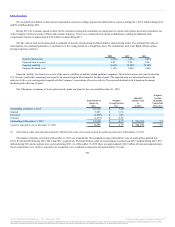
The weighted-average assumptions used in computing the benefit obligations of the U.S. Pension Plans, International Pension Plans and U.S. Retiree
Medical Plan are as follows:
Discount rate as of year-end 4.84% 4.04% 4.58%
Discount rate as of year-end 4.84% 4.04% 4.58%
Discount rate as of year-end 4.70% 4.03% 4.82%
Range of compensation rate increase 3.52% 3.14% 3.44%
The discount rate used in the calculation of the benefit obligation at December 31, 2013 and December 31, 2012 for the U.S. Plans is derived from a
yield curve comprised of the yields of approximately 700 and 650 market-weighted corporate bonds, respectively, rated AA on average by Moody’s,
Standard & Poor’s, and Fitch, matched against the cash flows of the U.S. Plans. The discount rate used in the calculation of the benefit obligation at
December 31, 2013 and December 31, 2012 for the International Pension Plans is primarily derived from the yields on Swiss government bonds with a
maturity matched against the cash flows of the International Pension Plans.
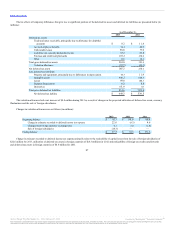
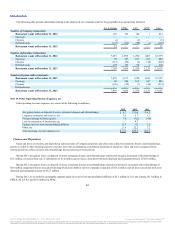
The weighted-average assumptions used in computing the net periodic benefit cost of the U.S. Pension Plans, International Pension Plans and the
U.S. Retiree Medical Plan are as follows:
Discount rate 4.04% 4.58% 5.35%
Expected long-term rate of return on plan assets 6.05% 6.50% 7.50%
Discount rate 4.04% 4.58% 5.35%
Expected long-term rate of return on plan assets N/A N/A N/A
Discount rate 4.18% 4.86% 5.38%
Range of compensation rate increase 3.27% 3.47% 3.79%
Expected long-term rate of return on plan assets 5.64% 5.25% 6.49%
The expected long-term rate of return on plan assets is determined by expected future returns on the asset categories in target investment allocation. These
expected returns are based on historical returns for each asset’s category adjusted for an assessment of current market conditions.
The assumed healthcare cost trend rates are as follows:
Healthcare cost trend rate assumed for next year 8.00% 8.00% 8.00%
Rate to which the cost trend rate is assumed to decline (the ultimate trend rate) 5.00% 5.00% 5.00%
Year that the rate reaches the ultimate trend rate 2020 2020 2020
92
Source: Burger King Worldwide, Inc., 10-K, February 21, 2014 Powered by Morningstar® Document Research℠
The information contained herein may not be copied, adapted or distributed and is not warranted to be accurate, complete or timely. The user assumes all risks for any damages or losses arising from any use of this
information, except to the extent such damages or losses cannot be limited or excluded by applicable law. Past financial performance is no guarantee of future results.