Burger King 2013 Annual Report Download - page 95
Download and view the complete annual report
Please find page 95 of the 2013 Burger King annual report below. You can navigate through the pages in the report by either clicking on the pages listed below, or by using the keyword search tool below to find specific information within the annual report.-
 1
1 -
2
-
3
-
4
-
5
-
6
-
7
-
8
-
9
-
10
-
11
-
12
-
13
-
14
-
15
-
16
-
17
-
18
-
19
-
20
-
21
-
22
-
23
-
24
-
25
-
26
-
27
-
28
-
29
-
30
-
31
-
32
-
33
-
34
-
35
-
36
-
37
-
38
-
39
-
40
-
41
-
42
-
43
-
44
-
45
-
46
-
47
-
48
-
49
-
50
-
51
-
52
-
53
-
54
-
55
-
56
-
57
-
58
-
59
-
60
-
61
-
62
-
63
-
64
-
65
-
66
-
67
-
68
-
69
-
70
-
71
-
72
-
73
-
74
-
75
-
76
-
77
-
78
-
79
-
80
-
81
-
82
-
83
-
84
-
 85
85 -
 86
86 -
 87
87 -
 88
88 -
 89
89 -
 90
90 -
 91
91 -
 92
92 -
 93
93 -
 94
94 -
 95
95 -
 96
96 -
 97
97 -
 98
98 -
 99
99 -
 100
100 -
 101
101 -
 102
102 -
 103
103 -
 104
104 -
 105
105 -
106
-
107
-
108
-
109
-
110
-
111
-
112
-
113
-
114
-
115
-
116
-
117
-
118
-
119
-
120
-
121
-
122
-
123
-
124
-
125
-
126
-
127
-
128
-
129
-
130
-
131
-
132
-
133
-
134
-
135
-
136
-
137
-
138
-
139
-
140
-
141
-
142
-
143
-
144
-
145
-
146
-
147
-
148
-
149
-
150
-
151
-
152
-
153
-
154
-
155
-
156
-
157
-
158
-
159
-
160
-
161
-
162
-
163
-
164
-
165
-
166
-
167
-
168
-
169
-
170
-
171
-
172
-
173
-
174
-
175
-
176
-
177
-
178
-
179
-
180
-
181
-
182
-
183
-
184
-
185
-
186
-
187
-
188
-
189
-
190
-
191
-
192
-
193
-
194
-
195
-
196
-
197
-
198
-
199
-
200
-
201
-
202
-
203
-
204
-
205
-
206
-
207
-
208
-
209
-
210
-
211
 |
 |

Table of Contents
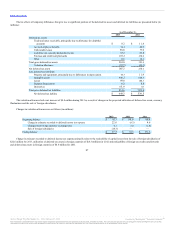
Assumed healthcare cost trend rates do not have a significant effect on the amounts reported for the postretirement healthcare plans, since a one-
percentage point increase or decrease in the assumed healthcare cost trend rate would have a minimal effect on service and interest cost for the postretirement
obligation.
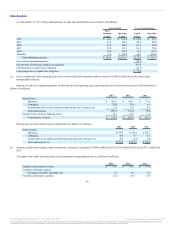
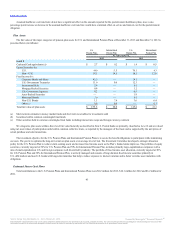
The fair value of the major categories of pension plan assets for U.S. and International Pension Plans at December 31, 2013 and December 31, 2012 is
presented below (in millions):
Cash and Cash equivalents (a) $ 2.7 $ 0.2 $ 1.4 $ 0.5
Equity Securities (b):
U.S. 44.0 5.5 70.1 4.3
Non—U.S. 38.1 14.5 18.1 12.0
Fixed Income (b) :
Corporate Bonds and Notes 45.3 — 34.1 —
U.S. Government Treasuries 11.6 0.6 12.3 —
International Debt 3.9 — 0.1 —
Mortgage-Backed Securities 0.9 — 3.2 —
U.S. Government Agencies 8.2 — 0.5 —
Asset-Backed Securities — — 1.9 —
Municipal Bonds 3.0 — 0.1 —
Non-U.S. Bonds 1.1 7.4 3.6 6.4
Other (c) 0.8 0.6 — 0.1
Total fair value of plan assets $159.6 $ 28.8 $145.4 $23.3
(a) Short-term investments in money market funds and short term receivables for investments sold
(b) Securities held in common commingled trust funds
(c) Other securities held in common commingled trust funds including interest rate swaps and foreign currency contracts
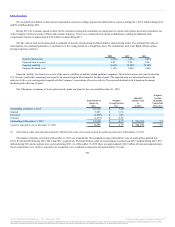
We categorize plan assets within a three level fair value hierarchy as described in Note 2. Pooled funds are primarily classified as Level 2 and are valued
using net asset values of participation units held in common collective trusts, as reported by the managers of the trusts and as supported by the unit prices of
actual purchase and sale transactions.
The investment objective for the U.S. Pension Plans and International Pension Plans is to secure the benefit obligations to participants while minimizing
our costs. The goal is to optimize the long-term return on plan assets at an average level of risk. The Investment Committee developed a strategic allocation
policy for the U.S. Pension Plan to reduce return seeking assets and increase fixed income assets as the Plan’s funded status improves. The portfolio of equity
securities, currently targeted at 50% for U.S. Pension Plan and 70% for International Pension Plan, includes primarily large-capitalization companies with a
mix of small-capitalization U.S. and foreign companies well diversified by industry. The portfolio of fixed income asset allocation, currently targeted at 50%
for U.S. Pension Plan and 30% for International Pension Plan, is actively managed and consists of long duration fixed income securities primarily in
U.S. debt markets and non-U.S. bonds with long-term maturities that help to reduce exposure to interest variation and to better correlate asset maturities with
obligations.
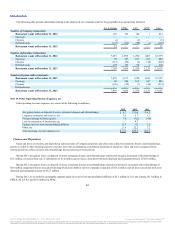
Total contributions to the U.S. Pension Plans and International Pension Plans were $8.2 million for 2013, $10.1 million for 2012 and $6.2 million for
2011.
93
Source: Burger King Worldwide, Inc., 10-K, February 21, 2014 Powered by Morningstar® Document Research℠
The information contained herein may not be copied, adapted or distributed and is not warranted to be accurate, complete or timely. The user assumes all risks for any damages or losses arising from any use of this
information, except to the extent such damages or losses cannot be limited or excluded by applicable law. Past financial performance is no guarantee of future results.