Burger King 2013 Annual Report Download - page 49
Download and view the complete annual report
Please find page 49 of the 2013 Burger King annual report below. You can navigate through the pages in the report by either clicking on the pages listed below, or by using the keyword search tool below to find specific information within the annual report.-
 1
1 -
2
-
3
-
4
-
5
-
6
-
7
-
8
-
9
-
10
-
11
-
12
-
13
-
14
-
15
-
16
-
17
-
18
-
19
-
20
-
21
-
22
-
23
-
24
-
25
-
26
-
27
-
28
-
29
-
30
-
31
-
32
-
33
-
34
-
35
-
36
-
37
-
38
-
 39
39 -
 40
40 -
 41
41 -
 42
42 -
 43
43 -
 44
44 -
 45
45 -
 46
46 -
 47
47 -
 48
48 -
 49
49 -
 50
50 -
 51
51 -
 52
52 -
 53
53 -
 54
54 -
 55
55 -
 56
56 -
 57
57 -
 58
58 -
 59
59 -
60
-
61
-
62
-
63
-
64
-
65
-
66
-
67
-
68
-
69
-
70
-
71
-
72
-
73
-
74
-
75
-
76
-
77
-
78
-
79
-
80
-
81
-
82
-
83
-
84
-
85
-
86
-
87
-
88
-
89
-
90
-
91
-
92
-
93
-
94
-
95
-
96
-
97
-
98
-
99
-
100
-
101
-
102
-
103
-
104
-
105
-
106
-
107
-
108
-
109
-
110
-
111
-
112
-
113
-
114
-
115
-
116
-
117
-
118
-
119
-
120
-
121
-
122
-
123
-
124
-
125
-
126
-
127
-
128
-
129
-
130
-
131
-
132
-
133
-
134
-
135
-
136
-
137
-
138
-
139
-
140
-
141
-
142
-
143
-
144
-
145
-
146
-
147
-
148
-
149
-
150
-
151
-
152
-
153
-
154
-
155
-
156
-
157
-
158
-
159
-
160
-
161
-
162
-
163
-
164
-
165
-
166
-
167
-
168
-
169
-
170
-
171
-
172
-
173
-
174
-
175
-
176
-
177
-
178
-
179
-
180
-
181
-
182
-
183
-
184
-
185
-
186
-
187
-
188
-
189
-
190
-
191
-
192
-
193
-
194
-
195
-
196
-
197
-
198
-
199
-
200
-
201
-
202
-
203
-
204
-
205
-
206
-
207
-
208
-
209
-
210
-
211
 |
 |

Table of Contents
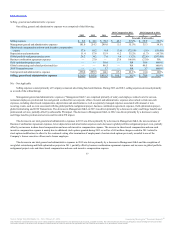
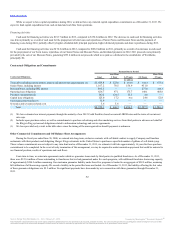
Comparable Sales
During 2013, system comparable sales growth of 4.1% in APAC was driven by comparable sales growth in Australia, China and South Korea, partially
offset by negative comparable sales growth in Japan and New Zealand.
During 2012, negative system comparable sales growth of 0.5% in APAC was driven by negative comparable sales growth in South Korea, Japan, New
Zealand and China, partially offset by positive comparable sales growth in Australia.
Company restaurants
During 2013 and 2012, Company restaurant revenues decreased due to the net refranchising of Company restaurants during 2012 and unfavorable FX
impact. As of December 1, 2013, we ceased to have any Company restaurants in APAC.
During 2012, CRM% increased primarily as a result of the leveraging effect of Company comparable sales growth on our fixed occupancy and other
operating costs and lower food, paper and product costs, partially offset by higher labor costs in Singapore.
Franchise and Property
During 2013, franchise and property revenues increased due to an increase in royalties driven by comparable sales growth and net restaurant growth.
Additionally, franchise and property revenues increased as a result of a $2.7 million increase in franchise fees and other revenue mainly driven by the increase
in the number of restaurant openings. These factors were partially offset by unfavorable FX impact.
During 2013, franchise and property expenses decreased primarily due to a decrease in bad debt expense of approximately $0.2 million as a result of
higher recoveries in the current year.
During 2012, franchise and property revenues increased due to an increase in royalties driven by net restaurant growth and the net refranchising of
Company restaurants during 2012. Additionally, franchise and property revenues increased as a result of a $2.7 million increase in franchise fees and other
revenue mainly driven by the increase in the number of restaurant openings. These factors were partially offset by negative comparable sales growth.
During 2012, franchise and property expenses were relatively unchanged from the prior year.
Segment income
During 2013 and 2012, segment income increased due to a decrease in Segment SG&A and an increase in franchise and property revenues net of
expenses. During 2013 these factors were partially offset by a decrease in CRM.
47
Source: Burger King Worldwide, Inc., 10-K, February 21, 2014 Powered by Morningstar® Document Research℠
The information contained herein may not be copied, adapted or distributed and is not warranted to be accurate, complete or timely. The user assumes all risks for any damages or losses arising from any use of this
information, except to the extent such damages or losses cannot be limited or excluded by applicable law. Past financial performance is no guarantee of future results.