Burger King 2013 Annual Report Download - page 65
Download and view the complete annual report
Please find page 65 of the 2013 Burger King annual report below. You can navigate through the pages in the report by either clicking on the pages listed below, or by using the keyword search tool below to find specific information within the annual report.-
 1
1 -
2
-
3
-
4
-
5
-
6
-
7
-
8
-
9
-
10
-
11
-
12
-
13
-
14
-
15
-
16
-
17
-
18
-
19
-
20
-
21
-
22
-
23
-
24
-
25
-
26
-
27
-
28
-
29
-
30
-
31
-
32
-
33
-
34
-
35
-
36
-
37
-
38
-
39
-
40
-
41
-
42
-
43
-
44
-
45
-
46
-
47
-
48
-
49
-
50
-
51
-
52
-
53
-
54
-
 55
55 -
 56
56 -
 57
57 -
 58
58 -
 59
59 -
 60
60 -
 61
61 -
 62
62 -
 63
63 -
 64
64 -
 65
65 -
 66
66 -
 67
67 -
 68
68 -
 69
69 -
 70
70 -
 71
71 -
 72
72 -
 73
73 -
 74
74 -
 75
75 -
76
-
77
-
78
-
79
-
80
-
81
-
82
-
83
-
84
-
85
-
86
-
87
-
88
-
89
-
90
-
91
-
92
-
93
-
94
-
95
-
96
-
97
-
98
-
99
-
100
-
101
-
102
-
103
-
104
-
105
-
106
-
107
-
108
-
109
-
110
-
111
-
112
-
113
-
114
-
115
-
116
-
117
-
118
-
119
-
120
-
121
-
122
-
123
-
124
-
125
-
126
-
127
-
128
-
129
-
130
-
131
-
132
-
133
-
134
-
135
-
136
-
137
-
138
-
139
-
140
-
141
-
142
-
143
-
144
-
145
-
146
-
147
-
148
-
149
-
150
-
151
-
152
-
153
-
154
-
155
-
156
-
157
-
158
-
159
-
160
-
161
-
162
-
163
-
164
-
165
-
166
-
167
-
168
-
169
-
170
-
171
-
172
-
173
-
174
-
175
-
176
-
177
-
178
-
179
-
180
-
181
-
182
-
183
-
184
-
185
-
186
-
187
-
188
-
189
-
190
-
191
-
192
-
193
-
194
-
195
-
196
-
197
-
198
-
199
-
200
-
201
-
202
-
203
-
204
-
205
-
206
-
207
-
208
-
209
-
210
-
211
 |
 |

Table of Contents
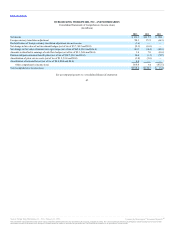
Consolidated Statements of Comprehensive Income (Loss)
(In millions)
Net income $ 233.7 $117.7 $ 88.1
Foreign currency translation adjustment 50.1 15.5 (44.3)
Reclassification of foreign currency translation adjustment into net income (3.0) — —
Net change in fair value of net investment hedges (net of tax of $5.7, $4.2 and $0.0) (9.1) (6.6) —
Net change in fair value of interest rate caps/swaps (net of tax of $65.8, $6.4 and $26.4) 103.3 (10.0) (40.9)
Amounts reclassified to earnings of cash flow hedges (net of tax of $2.3, $4.6 and $0.4) 3.8 7.0 (0.6)
Pension and post-retirement benefit plans (net of tax of $10.7, $0.2 and $5.8) 20.8 (1.3) (9.7)
Amortization of prior service costs (net of tax of $1.2, $1.0 and $0.0) (1.8) (1.6) —
Amortization of actuarial losses (net of tax of $0.4, $0.0 and $0.0) 0.8 — —
Other comprehensive income (loss) 164.9 3.0 (95.5)
Total comprehensive income (loss) $398.6 $120.7 $(7.4)
See accompanying notes to consolidated financial statements.
63
Source: Burger King Worldwide, Inc., 10-K, February 21, 2014 Powered by Morningstar® Document Research℠
The information contained herein may not be copied, adapted or distributed and is not warranted to be accurate, complete or timely. The user assumes all risks for any damages or losses arising from any use of this
information, except to the extent such damages or losses cannot be limited or excluded by applicable law. Past financial performance is no guarantee of future results.