Burger King 2013 Annual Report Download - page 35
Download and view the complete annual report
Please find page 35 of the 2013 Burger King annual report below. You can navigate through the pages in the report by either clicking on the pages listed below, or by using the keyword search tool below to find specific information within the annual report.-
 1
1 -
2
-
3
-
4
-
5
-
6
-
7
-
8
-
9
-
10
-
11
-
12
-
13
-
14
-
15
-
16
-
17
-
18
-
19
-
20
-
21
-
22
-
23
-
24
-
 25
25 -
 26
26 -
 27
27 -
 28
28 -
 29
29 -
 30
30 -
 31
31 -
 32
32 -
 33
33 -
 34
34 -
 35
35 -
 36
36 -
 37
37 -
 38
38 -
 39
39 -
 40
40 -
 41
41 -
 42
42 -
 43
43 -
 44
44 -
 45
45 -
46
-
47
-
48
-
49
-
50
-
51
-
52
-
53
-
54
-
55
-
56
-
57
-
58
-
59
-
60
-
61
-
62
-
63
-
64
-
65
-
66
-
67
-
68
-
69
-
70
-
71
-
72
-
73
-
74
-
75
-
76
-
77
-
78
-
79
-
80
-
81
-
82
-
83
-
84
-
85
-
86
-
87
-
88
-
89
-
90
-
91
-
92
-
93
-
94
-
95
-
96
-
97
-
98
-
99
-
100
-
101
-
102
-
103
-
104
-
105
-
106
-
107
-
108
-
109
-
110
-
111
-
112
-
113
-
114
-
115
-
116
-
117
-
118
-
119
-
120
-
121
-
122
-
123
-
124
-
125
-
126
-
127
-
128
-
129
-
130
-
131
-
132
-
133
-
134
-
135
-
136
-
137
-
138
-
139
-
140
-
141
-
142
-
143
-
144
-
145
-
146
-
147
-
148
-
149
-
150
-
151
-
152
-
153
-
154
-
155
-
156
-
157
-
158
-
159
-
160
-
161
-
162
-
163
-
164
-
165
-
166
-
167
-
168
-
169
-
170
-
171
-
172
-
173
-
174
-
175
-
176
-
177
-
178
-
179
-
180
-
181
-
182
-
183
-
184
-
185
-
186
-
187
-
188
-
189
-
190
-
191
-
192
-
193
-
194
-
195
-
196
-
197
-
198
-
199
-
200
-
201
-
202
-
203
-
204
-
205
-
206
-
207
-
208
-
209
-
210
-
211
 |
 |

Table of Contents
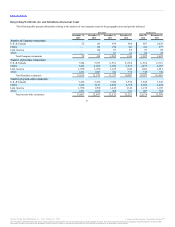
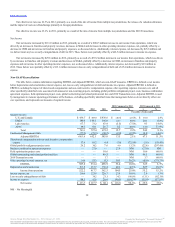
During 2011, we initiated a project to realign our global restaurant portfolio by refranchising our Company restaurants and establishing strategic
partnerships to accelerate development through joint ventures and master franchise and development agreements (the “global portfolio realignment project”). As
a result of the global portfolio realignment project, we incurred $26.2 million of general and administrative expenses consisting of professional fees and
severance in 2013, $30.2 million in 2012 and $7.6 million in 2011. We completed our global portfolio realignment project, including our refranchising
initiative, in 2013. We continue to own and operate 52 restaurants in Miami, Florida, which we expect to use as a base for the testing of new products and
systems. We also expect to continue to enter into joint ventures and master franchise and development agreements as part of our business strategy to accelerate
development, but we do not currently intend to make any adjustments based on expenses that we incur in connection with these arrangements.
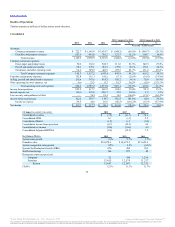
As a result of the global portfolio realignment project, our Company restaurant revenues and Company restaurant expenses have significantly decreased
while our franchise and property revenues and franchise and property expenses have increased. Additionally, our selling expenses have decreased as a result of
a decrease in advertising fund contributions for Company restaurants following the refranchisings.
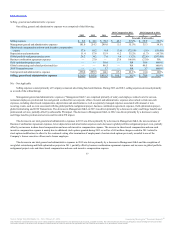
During 2013, we refranchised 33 restaurants in the United States and 94 restaurants in Canada and entered into a master franchise and development
agreement for Canada with the franchisee. During the same period, we refranchised 98 Company restaurants in Mexico to a joint venture with an existing
franchisee in exchange for cash and a minority interest in the joint venture and entered into a master franchise and development agreement for Mexico with the
joint venture. We also refranchised 91 restaurants in Germany and 41 restaurants in Spain.
On April 3, 2012, Burger King Worldwide Holdings, Inc., a Delaware corporation and the indirect parent company of Holdings (“Worldwide”), entered
into a Business Combination Agreement and Plan of Merger with Justice Holdings Limited and its affiliates (the “Business Combination Agreement”). We did
not incur any expenses during 2013 related to the Business Combination Agreement. We recorded $27.0 million of general and administrative expenses
associated with the Business Combination Agreement during 2012, consisting of $5.9 million of one-time share-based compensation expense as a result of the
increase in our equity value implied by the Business Combination Agreement and $21.1 million of professional fees and other transaction costs.
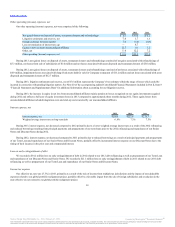
During 2011, we completed a project to significantly expand and enhance our U.S. field organization to better support our franchisees in an effort to
drive sales, increase profits and improve restaurant operations (the “field optimization project”). As a result of the field optimization project, we incurred $10.6
million in 2011 of severance related costs, compensation costs for overlap staffing, travel expenses, consulting fees and training costs.
In 2011, we completed a global restructuring plan that resulted in work force reductions throughout our organization. In June 2011, we implemented a
Voluntary Resignation Severance Program (“VRS Program”) offered for a limited time to eligible employees based at our Miami headquarters. In addition, other
involuntary work force reductions were also implemented. As a result of the global restructuring plan, VRS Program and the additional workforce reductions,
we incurred $46.5 million of severance benefits and other severance related costs in 2011.
In connection with the 3G Acquisition and related financing transactions, we incurred costs of $3.7 million in 2011 consisting of investment banking,
legal fees and compensation related expenses.
33
Source: Burger King Worldwide, Inc., 10-K, February 21, 2014 Powered by Morningstar® Document Research℠
The information contained herein may not be copied, adapted or distributed and is not warranted to be accurate, complete or timely. The user assumes all risks for any damages or losses arising from any use of this
information, except to the extent such damages or losses cannot be limited or excluded by applicable law. Past financial performance is no guarantee of future results.