Burger King 2013 Annual Report Download - page 40
Download and view the complete annual report
Please find page 40 of the 2013 Burger King annual report below. You can navigate through the pages in the report by either clicking on the pages listed below, or by using the keyword search tool below to find specific information within the annual report.-
 1
1 -
2
-
3
-
4
-
5
-
6
-
7
-
8
-
9
-
10
-
11
-
12
-
13
-
14
-
15
-
16
-
17
-
18
-
19
-
20
-
21
-
22
-
23
-
24
-
25
-
26
-
27
-
28
-
29
-
 30
30 -
 31
31 -
 32
32 -
 33
33 -
 34
34 -
 35
35 -
 36
36 -
 37
37 -
 38
38 -
 39
39 -
 40
40 -
 41
41 -
 42
42 -
 43
43 -
 44
44 -
 45
45 -
 46
46 -
 47
47 -
 48
48 -
 49
49 -
 50
50 -
51
-
52
-
53
-
54
-
55
-
56
-
57
-
58
-
59
-
60
-
61
-
62
-
63
-
64
-
65
-
66
-
67
-
68
-
69
-
70
-
71
-
72
-
73
-
74
-
75
-
76
-
77
-
78
-
79
-
80
-
81
-
82
-
83
-
84
-
85
-
86
-
87
-
88
-
89
-
90
-
91
-
92
-
93
-
94
-
95
-
96
-
97
-
98
-
99
-
100
-
101
-
102
-
103
-
104
-
105
-
106
-
107
-
108
-
109
-
110
-
111
-
112
-
113
-
114
-
115
-
116
-
117
-
118
-
119
-
120
-
121
-
122
-
123
-
124
-
125
-
126
-
127
-
128
-
129
-
130
-
131
-
132
-
133
-
134
-
135
-
136
-
137
-
138
-
139
-
140
-
141
-
142
-
143
-
144
-
145
-
146
-
147
-
148
-
149
-
150
-
151
-
152
-
153
-
154
-
155
-
156
-
157
-
158
-
159
-
160
-
161
-
162
-
163
-
164
-
165
-
166
-
167
-
168
-
169
-
170
-
171
-
172
-
173
-
174
-
175
-
176
-
177
-
178
-
179
-
180
-
181
-
182
-
183
-
184
-
185
-
186
-
187
-
188
-
189
-
190
-
191
-
192
-
193
-
194
-
195
-
196
-
197
-
198
-
199
-
200
-
201
-
202
-
203
-
204
-
205
-
206
-
207
-
208
-
209
-
210
-
211
 |
 |

Table of Contents
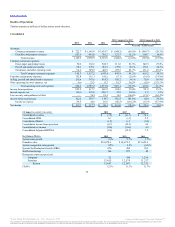
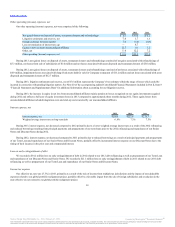
Other operating (income) expenses, net
Our other operating (income) expenses, net were comprised of the following:
Net (gains) losses on disposal of assets, restaurant closures and refranchisings $ 0.7 $ 30.8 $ 6.2
Litigation settlements and reserves, net 7.6 1.7 1.3
Foreign exchange net losses (gains) 7.4 (4.2) (4.6)
Loss on termination of interest rate cap — 8.7 —
Equity in net loss from unconsolidated affiliates 12.7 4.1 1.2
Other, net 5.6 12.2 7.2
Other operating (income) expenses, net $34.0 $53.3 $11.3
During 2013, net (gains) losses on disposal of assets, restaurant closures and refranchisings consisted of net gains associated with refranchisings of
$5.3 million, net losses from sale of subsidiaries of $1.0 million and net losses associated with asset disposals and restaurant closures of $5.0 million.
During 2012, net (gains) losses on disposal of assets, restaurant closures and refranchisings consisted of net losses associated with refranchisings of
$4.9 million, impairment losses associated with long-lived assets held for sale for Company restaurants of $13.2 million and net losses associated with asset
disposals and restaurant closures of $12.7 million.
During 2013, litigation settlements and reserves, net of $7.6 million represent the Company’s best estimate within the range of losses which could be
incurred in connection with pending litigation matters. See Note 20 of the accompanying audited Consolidated Financial Statements included in Part II, Item 8
“Financial Statements and Supplementary Data” for additional information about accounting for our litigation reserves.
During 2013, the increase in equity in net loss from unconsolidated affiliates mainly pertains to losses recognized on our equity investments acquired
during 2012 and reflects a full year of equity investment losses in 2013 compared to approximately three months during 2012. These equity losses from
unconsolidated affiliates included integration costs and start-up costs incurred by our unconsolidated affiliates.
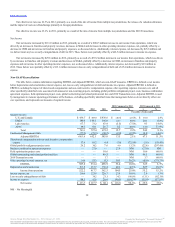
Interest expense, net
Interest expense, net $200.0 $223.8 $226.7
Weighted average interest rate on long-term debt 6.6% 7.3% 7.5%
During 2013, interest expense, net decreased compared to 2012 primarily due to a lower weighted average interest rate as a result of the 2012 refinancing
and reduced borrowings resulting from principal payments and prepayments of our term loans prior to the 2012 refinancing and repurchases of our Senior
Notes and Discount Notes during 2012.
During 2012, interest expense, net decreased compared to 2011 primarily due to reduced borrowings as a result of principal payments and prepayments
of our Term Loan and repurchases of our Senior Notes and Discount Notes, partially offset by incremental interest expense on our Discount Notes due to the
timing of their issuance in the prior year and compounded interest.
Loss on early extinguishment of debt
We recorded a $34.2 million loss on early extinguishment of debt in 2012 related to our 2012 debt refinancing as well as prepayments of our Term Loan
and repurchases of our Discount Notes and Senior Notes. We recorded a $21.1 million loss on early extinguishment of debt in 2011 related to our 2011 debt
refinancing as well as prepayments of our Term Loan and repurchases of our Senior Notes and Discount Notes.
Income tax expense
Our effective tax rate was 27.5% in 2013, primarily as a result of the mix of income from multiple tax jurisdictions and the impact of non-deductible
expenses related to our global portfolio realignment project, partially offset by a favorable impact from the sale of foreign subsidiaries and a reduction in the
state effective tax rate related to our global portfolio realignment project.
38
Source: Burger King Worldwide, Inc., 10-K, February 21, 2014 Powered by Morningstar® Document Research℠
The information contained herein may not be copied, adapted or distributed and is not warranted to be accurate, complete or timely. The user assumes all risks for any damages or losses arising from any use of this
information, except to the extent such damages or losses cannot be limited or excluded by applicable law. Past financial performance is no guarantee of future results.