Burger King 2013 Annual Report Download - page 103
Download and view the complete annual report
Please find page 103 of the 2013 Burger King annual report below. You can navigate through the pages in the report by either clicking on the pages listed below, or by using the keyword search tool below to find specific information within the annual report.-
 1
1 -
2
-
3
-
4
-
5
-
6
-
7
-
8
-
9
-
10
-
11
-
12
-
13
-
14
-
15
-
16
-
17
-
18
-
19
-
20
-
21
-
22
-
23
-
24
-
25
-
26
-
27
-
28
-
29
-
30
-
31
-
32
-
33
-
34
-
35
-
36
-
37
-
38
-
39
-
40
-
41
-
42
-
43
-
44
-
45
-
46
-
47
-
48
-
49
-
50
-
51
-
52
-
53
-
54
-
55
-
56
-
57
-
58
-
59
-
60
-
61
-
62
-
63
-
64
-
65
-
66
-
67
-
68
-
69
-
70
-
71
-
72
-
73
-
74
-
75
-
76
-
77
-
78
-
79
-
80
-
81
-
82
-
83
-
84
-
85
-
86
-
87
-
88
-
89
-
90
-
91
-
92
-
 93
93 -
 94
94 -
 95
95 -
 96
96 -
 97
97 -
 98
98 -
 99
99 -
 100
100 -
 101
101 -
 102
102 -
 103
103 -
 104
104 -
 105
105 -
 106
106 -
 107
107 -
 108
108 -
 109
109 -
 110
110 -
 111
111 -
 112
112 -
 113
113 -
114
-
115
-
116
-
117
-
118
-
119
-
120
-
121
-
122
-
123
-
124
-
125
-
126
-
127
-
128
-
129
-
130
-
131
-
132
-
133
-
134
-
135
-
136
-
137
-
138
-
139
-
140
-
141
-
142
-
143
-
144
-
145
-
146
-
147
-
148
-
149
-
150
-
151
-
152
-
153
-
154
-
155
-
156
-
157
-
158
-
159
-
160
-
161
-
162
-
163
-
164
-
165
-
166
-
167
-
168
-
169
-
170
-
171
-
172
-
173
-
174
-
175
-
176
-
177
-
178
-
179
-
180
-
181
-
182
-
183
-
184
-
185
-
186
-
187
-
188
-
189
-
190
-
191
-
192
-
193
-
194
-
195
-
196
-
197
-
198
-
199
-
200
-
201
-
202
-
203
-
204
-
205
-
206
-
207
-
208
-
209
-
210
-
211
 |
 |

Table of Contents
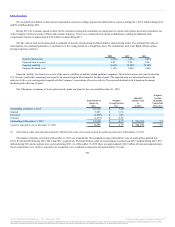
The Company has granted RSUs to non-employee members of our Board of Directors in lieu of a cash retainer and committee fees. The RSU grants
were fully vested on the grant date and the fair value of the RSU awards were based on the closing price of our stock on the date of grant. All RSUs will settle
and shares of Common Stock will be issued upon termination of service by the board member. The following is a summary of RSU activity for the year
ended December 31, 2013:
Nonvested shares at January 1, 2013 205 $ 6.55
Granted 38 $ 22.74
Vested & Settled (39) $ 6.03
Forfeited — —
Nonvested shares at December 31, 2013 204 $9.68
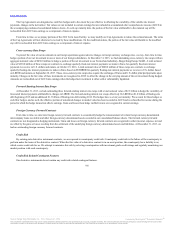
The weighted average grant date fair value of RSUs granted was $22.74 during 2013 and $6.55 during 2012. No RSUs were granted during 2011. The
total intrinsic value of RSUs which have vested and settled was $0.8 million during 2013. No RSUs vested and settled during 2012 and 2011.
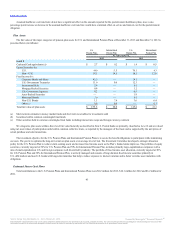
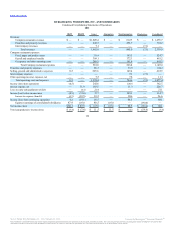
Basic earnings per share is computed by dividing net income by the weighted average number of common shares outstanding during the period. Diluted
earnings per share is computed by dividing net income by the weighted average number of common shares outstanding during the period adjusted for the
dilutive effect of stock options. We exclude stock options from the calculation of diluted earnings per share if the effect of including such stock options is anti-
dilutive.
Basic and diluted earnings per share are as follows (in millions except for per share information):
Net income $ 233.7 $117.7 $ 88.1
Weighted average shares—basic 351.0 349.7 348.2
Effect of dilutive securities 6.8 4.4 —
Weighted average shares—diluted 357.8 354.1 348.2
Basic earnings per share $ 0.67 $0.34 $ 0.25
Diluted earnings per share $0.65 $0.33 $ 0.25
Anti-dilutive stock options outstanding 2.9 2.7 12.5
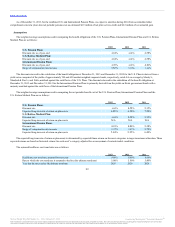
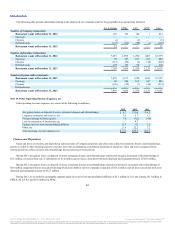
Franchise and property revenues consist of the following (in millions):
Franchise royalties $657.0 $603.5 $565.5
Property revenues 213.7 151.3 111.2
Franchise fees and other revenue 52.9 47.1 24.5
Franchise and property revenues $923.6 $801.9 $701.2
Refer to Note 10 for the components of property revenues.
101
Source: Burger King Worldwide, Inc., 10-K, February 21, 2014 Powered by Morningstar® Document Research℠
The information contained herein may not be copied, adapted or distributed and is not warranted to be accurate, complete or timely. The user assumes all risks for any damages or losses arising from any use of this
information, except to the extent such damages or losses cannot be limited or excluded by applicable law. Past financial performance is no guarantee of future results.