Burger King 2013 Annual Report Download - page 9
Download and view the complete annual report
Please find page 9 of the 2013 Burger King annual report below. You can navigate through the pages in the report by either clicking on the pages listed below, or by using the keyword search tool below to find specific information within the annual report.
Table of Contents
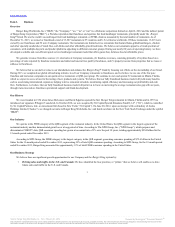
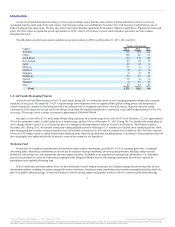
As part of our international growth strategy, we have created strategic master franchise joint ventures in China and India in which we received a
meaningful minority equity stake in the joint venture. Our India joint venture was established in November 2013 with Everstone Capital Partners, one of
India’s leading private equity firms. We have also entered into master franchise agreements for Singapore, Malaysia, South Korea, Pakistan, Sri Lanka and
Japan. We believe there are significant growth opportunities in APAC, and we will continue to pursue master franchise agreements and joint ventures
throughout the region.
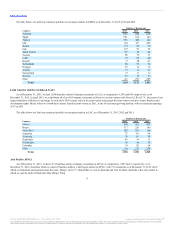
The table below sets forth our restaurant portfolio in our major markets in APAC as of December 31, 2013, 2012 and 2011:
Australia 371 357 347
China 190 86 56
South Korea 164 139 128
New Zealand 86 82 79
Japan 82 64 44
Malaysia 56 43 34
Indonesia 48 40 30
Singapore 43 41 45
Philippines 36 29 25
Taiwan 36 41 44
Thailand 34 29 27
Other 85 59 49
As part of our Four Pillars strategy for the U.S. and Canada, during 2013 we continued to focus on our re-imaging program to enhance the restaurant
experience of our guests. The improved “20/20” restaurant design draws inspiration from our signature flame-grilled cooking process and incorporates a
variety of innovative elements to a backdrop that evokes the industrial look of corrugated metal, brick, wood and concrete. Rigorous consumer testing
confirmed the 20/20 image was the right one for the Burger King brand. Re-imaged restaurants have experienced a sales uplift of approximately 10% to 15%,
on average. The average cost to re-image a restaurant is approximately $300,000-$350,000.
Our goal is to have 40% of U.S. and Canada Burger King restaurants on a modern image by the end of 2015. As of December 31, 2013, approximately
30% of the restaurants in the U.S. and Canada are on a modern image, up from 19% as of December 31, 2012. During 2013 we launched the second phase of
our re-imaging initiative in the U.S. to accelerate the pace of re-imaging by offering temporary financial incentives to franchisees. This initiative ended in
December 2013. During 2012, we launched a third party lending program to provide financing to U.S. franchisees to facilitate their remodeling efforts. Third
party lending programs to finance restaurant remodels were also available to franchisees in 2013 and will continue to be available in 2014. We believe that our
lower-cost 20/20 image remodel, coupled with favorable financing terms offered by the third party lending programs, is an attractive value proposition that will
drive meaningful sales uplifts and provide an attractive return on investment for our franchisees.
Historically our Company restaurants and our franchisees make monthly contributions, generally 4% to 5% of restaurant gross sales, to managed
advertising funds. Advertising contributions are used to pay for expenses relating to marketing, advertising and promotion, including market research,
production, advertising costs, sales promotions and other support functions. In addition to the mandated advertising fund contributions, U.S. franchisees
may elect to participate in certain local advertising campaigns at the Designated Market Area level by making contributions beyond those required for
participation in the national advertising fund.
In the United States and other markets where we have historically owned Company restaurants, the Company manages the advertising fund. In other
international markets, including the markets managed by master franchisees, franchisees make contributions into franchisee-managed advertising funds. As
part of our global marketing strategy, we provide franchisees with advertising support and guidance in order to deliver a consistent global brand message.
7
Source: Burger King Worldwide, Inc., 10-K, February 21, 2014 Powered by Morningstar® Document Research℠
The information contained herein may not be copied, adapted or distributed and is not warranted to be accurate, complete or timely. The user assumes all risks for any damages or losses arising from any use of this
information, except to the extent such damages or losses cannot be limited or excluded by applicable law. Past financial performance is no guarantee of future results.

