Burger King 2013 Annual Report Download - page 53
Download and view the complete annual report
Please find page 53 of the 2013 Burger King annual report below. You can navigate through the pages in the report by either clicking on the pages listed below, or by using the keyword search tool below to find specific information within the annual report.-
 1
1 -
2
-
3
-
4
-
5
-
6
-
7
-
8
-
9
-
10
-
11
-
12
-
13
-
14
-
15
-
16
-
17
-
18
-
19
-
20
-
21
-
22
-
23
-
24
-
25
-
26
-
27
-
28
-
29
-
30
-
31
-
32
-
33
-
34
-
35
-
36
-
37
-
38
-
39
-
40
-
41
-
42
-
 43
43 -
 44
44 -
 45
45 -
 46
46 -
 47
47 -
 48
48 -
 49
49 -
 50
50 -
 51
51 -
 52
52 -
 53
53 -
 54
54 -
 55
55 -
 56
56 -
 57
57 -
 58
58 -
 59
59 -
 60
60 -
 61
61 -
 62
62 -
 63
63 -
64
-
65
-
66
-
67
-
68
-
69
-
70
-
71
-
72
-
73
-
74
-
75
-
76
-
77
-
78
-
79
-
80
-
81
-
82
-
83
-
84
-
85
-
86
-
87
-
88
-
89
-
90
-
91
-
92
-
93
-
94
-
95
-
96
-
97
-
98
-
99
-
100
-
101
-
102
-
103
-
104
-
105
-
106
-
107
-
108
-
109
-
110
-
111
-
112
-
113
-
114
-
115
-
116
-
117
-
118
-
119
-
120
-
121
-
122
-
123
-
124
-
125
-
126
-
127
-
128
-
129
-
130
-
131
-
132
-
133
-
134
-
135
-
136
-
137
-
138
-
139
-
140
-
141
-
142
-
143
-
144
-
145
-
146
-
147
-
148
-
149
-
150
-
151
-
152
-
153
-
154
-
155
-
156
-
157
-
158
-
159
-
160
-
161
-
162
-
163
-
164
-
165
-
166
-
167
-
168
-
169
-
170
-
171
-
172
-
173
-
174
-
175
-
176
-
177
-
178
-
179
-
180
-
181
-
182
-
183
-
184
-
185
-
186
-
187
-
188
-
189
-
190
-
191
-
192
-
193
-
194
-
195
-
196
-
197
-
198
-
199
-
200
-
201
-
202
-
203
-
204
-
205
-
206
-
207
-
208
-
209
-
210
-
211
 |
 |

Table of Contents
Finally, pursuant to the Discount Notes Indenture, BKCH is restricted from paying any dividend or making any payment or distribution on account of
its equity interests unless, among other things, (i) the dividend, payment or distribution (together with all other such dividends, payments or distributions
made since October 19, 2010) is less than an amount calculated based in part on the Consolidated Net Income (as defined in the Discount Notes Indenture) of
BKCH and its restricted subsidiaries since October 1, 2010, or (ii) the dividend, payment or distribution fits within one or more exceptions, including the
Permitted Distributions.
The restrictions under the 2012 Credit Agreement and the Indentures have resulted in the restricted net assets of each of BKC and BKCH exceeding 25%
of our consolidated net assets. Our restricted net assets at December 31, 2013 totaled $1,269.8 million.
As of December 31, 2013, we were in compliance with all covenants of the 2012 Credit Agreement and Indentures, and there were no limitations on our
ability to draw on the remaining availability under our 2012 Revolving Credit Facility.
At December 31, 2013, we had interest rate cap agreements (notional amount of $1.2 billion), (the “Cap Agreements”) to effectively cap the LIBOR
applicable to our variable rate borrowings at a weighted-average rate of 1.75% for U.S. Dollar denominated borrowings. The six year interest rate cap
agreements are a series of individual caplets that reset and settle quarterly consistent with the payment dates of our LIBOR-based term debt.
Under the terms of the Cap Agreements, if LIBOR resets above the strike price, we will receive the net difference between the rate and the strike price. In
addition, on quarterly settlement dates, we remit the deferred premium payment (plus interest) to the counterparty, whether LIBOR resets above or below the
strike price.
Operating Activities
Cash provided by operating activities was $325.2 million in 2013, compared to $224.4 million in 2012. The increase in cash provided by operating
activities was driven primarily by changes in working capital resulting from the timing of advertising expenditures, lower interest and income tax payments
and an increase in net income, excluding non-cash adjustments.
Cash provided by operating activities was $224.4 million in 2012 compared to $406.2 million in 2011. The decrease in cash provided by operating
activities resulted primarily from the refranchising of Company restaurants in 2012 which resulted in uses of working capital, a $75.9 million federal tax
refund received in 2011 and higher income taxes paid in 2012, partially offset by lower interest payments in 2012. The decrease in operating cash flows
attributable to the refranchisings reflects use of cash to settle the negative working capital positions of the restaurants refranchised in the period of
refranchising.
Investing Activities
Cash provided by investing activities was $43.0 million in 2013, compared to $33.6 million in 2012. The increase in cash provided by investing
activities was driven primarily as a result of a decrease in capital expenditures and a decrease in payments for acquired franchise operations, partially offset
by a decrease in proceeds from refranchisings, net.
Cash provided by investing activities was $33.6 million in 2012 compared to $41.4 million of cash used for investing activities in 2011, primarily as a
result of an increase in proceeds from refranchisings, net of payments for acquisitions, and a decrease in capital expenditures.
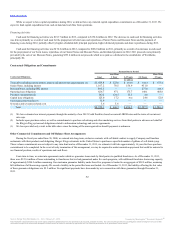
Capital expenditures have historically been comprised primarily of (i) costs to build new Company restaurants and new restaurants that we lease to
franchisees, (ii) costs to maintain the appearance of existing restaurants in accordance with our standards, including investments in new equipment and
remodeling and (iii) investments in information technology systems and corporate furniture and fixtures. The following table presents capital expenditures, by
type of expenditure:
New restaurants $ 1.1 $ 1.1 $ 6.8
Existing restaurants 11.2 49.0 65.7
Other, including corporate 13.2 20.1 9.6
Total $25.5 $70.2 $ 82.1
51
Source: Burger King Worldwide, Inc., 10-K, February 21, 2014 Powered by Morningstar® Document Research℠
The information contained herein may not be copied, adapted or distributed and is not warranted to be accurate, complete or timely. The user assumes all risks for any damages or losses arising from any use of this
information, except to the extent such damages or losses cannot be limited or excluded by applicable law. Past financial performance is no guarantee of future results.