Burger King 2013 Annual Report Download - page 36
Download and view the complete annual report
Please find page 36 of the 2013 Burger King annual report below. You can navigate through the pages in the report by either clicking on the pages listed below, or by using the keyword search tool below to find specific information within the annual report.-
 1
1 -
2
-
3
-
4
-
5
-
6
-
7
-
8
-
9
-
10
-
11
-
12
-
13
-
14
-
15
-
16
-
17
-
18
-
19
-
20
-
21
-
22
-
23
-
24
-
25
-
 26
26 -
 27
27 -
 28
28 -
 29
29 -
 30
30 -
 31
31 -
 32
32 -
 33
33 -
 34
34 -
 35
35 -
 36
36 -
 37
37 -
 38
38 -
 39
39 -
 40
40 -
 41
41 -
 42
42 -
 43
43 -
 44
44 -
 45
45 -
 46
46 -
47
-
48
-
49
-
50
-
51
-
52
-
53
-
54
-
55
-
56
-
57
-
58
-
59
-
60
-
61
-
62
-
63
-
64
-
65
-
66
-
67
-
68
-
69
-
70
-
71
-
72
-
73
-
74
-
75
-
76
-
77
-
78
-
79
-
80
-
81
-
82
-
83
-
84
-
85
-
86
-
87
-
88
-
89
-
90
-
91
-
92
-
93
-
94
-
95
-
96
-
97
-
98
-
99
-
100
-
101
-
102
-
103
-
104
-
105
-
106
-
107
-
108
-
109
-
110
-
111
-
112
-
113
-
114
-
115
-
116
-
117
-
118
-
119
-
120
-
121
-
122
-
123
-
124
-
125
-
126
-
127
-
128
-
129
-
130
-
131
-
132
-
133
-
134
-
135
-
136
-
137
-
138
-
139
-
140
-
141
-
142
-
143
-
144
-
145
-
146
-
147
-
148
-
149
-
150
-
151
-
152
-
153
-
154
-
155
-
156
-
157
-
158
-
159
-
160
-
161
-
162
-
163
-
164
-
165
-
166
-
167
-
168
-
169
-
170
-
171
-
172
-
173
-
174
-
175
-
176
-
177
-
178
-
179
-
180
-
181
-
182
-
183
-
184
-
185
-
186
-
187
-
188
-
189
-
190
-
191
-
192
-
193
-
194
-
195
-
196
-
197
-
198
-
199
-
200
-
201
-
202
-
203
-
204
-
205
-
206
-
207
-
208
-
209
-
210
-
211
 |
 |

Table of Contents
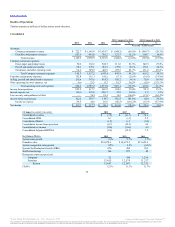
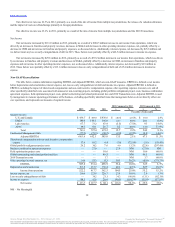
We evaluate our restaurants and assess our business based on the following operating metrics and key financial measures:
• System-wide sales growth refers to the change in sales at all Company and franchise restaurants in one period from the same period in the prior
year.
• Franchise sales represent sales at all franchise restaurants and are revenues to our franchisees. We do not record franchise sales as revenues;
however, our franchise revenues include royalties based on a percentage of franchise sales.
• Comparable sales growth refers to the change in restaurant sales in one period from the same prior year period for restaurants that have been
opened for thirteen months or longer.
• Net restaurant growth (“NRG”) represents the opening of new restaurants during a stated period, net of closures.
• Net refranchisings refer to sales of Company restaurants to franchisees, net of acquisitions of franchise restaurants by us.
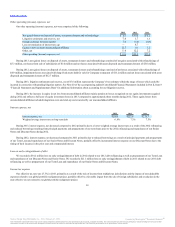
Comparable sales growth and system-wide sales growth are measured on a constant currency basis, which means the results exclude the effect of foreign
currency translation and are calculated by translating prior year results at current year exchange rates. We analyze certain key financial measures on a constant
currency basis as this helps identify underlying business trends, without distortion from the effects of currency movements (“FX impact”).
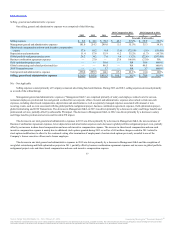
In addition, we assess our total business and evaluate our Company restaurants based on the following key financial measures:
• Adjusted EBITDA represents earnings (net income or loss) before interest, taxes, depreciation and amortization adjusted to exclude specifically
identified items that management believes do not directly reflect our core operations. See Non-GAAP Reconciliations.
• Company restaurant margin, or CRM, is derived by subtracting Company restaurant expenses from Company restaurant revenues for a stated
period, which we analyze as a percentage of Company restaurant revenues, a metric we refer to as Company restaurant margin %, or CRM%. As
a result of our refranchising initiative, the impact of CRM and CRM% on our operating results has substantially diminished, and therefore we
expect to discontinue the use of these metrics commencing in 2014.
34
Source: Burger King Worldwide, Inc., 10-K, February 21, 2014 Powered by Morningstar® Document Research℠
The information contained herein may not be copied, adapted or distributed and is not warranted to be accurate, complete or timely. The user assumes all risks for any damages or losses arising from any use of this
information, except to the extent such damages or losses cannot be limited or excluded by applicable law. Past financial performance is no guarantee of future results.