Burger King 2013 Annual Report Download - page 8
Download and view the complete annual report
Please find page 8 of the 2013 Burger King annual report below. You can navigate through the pages in the report by either clicking on the pages listed below, or by using the keyword search tool below to find specific information within the annual report.-
 1
1 -
 2
2 -
 3
3 -
 4
4 -
 5
5 -
 6
6 -
 7
7 -
 8
8 -
 9
9 -
 10
10 -
 11
11 -
 12
12 -
 13
13 -
 14
14 -
 15
15 -
 16
16 -
 17
17 -
 18
18 -
 19
19 -
20
-
21
-
22
-
23
-
24
-
25
-
26
-
27
-
28
-
29
-
30
-
31
-
32
-
33
-
34
-
35
-
36
-
37
-
38
-
39
-
40
-
41
-
42
-
43
-
44
-
45
-
46
-
47
-
48
-
49
-
50
-
51
-
52
-
53
-
54
-
55
-
56
-
57
-
58
-
59
-
60
-
61
-
62
-
63
-
64
-
65
-
66
-
67
-
68
-
69
-
70
-
71
-
72
-
73
-
74
-
75
-
76
-
77
-
78
-
79
-
80
-
81
-
82
-
83
-
84
-
85
-
86
-
87
-
88
-
89
-
90
-
91
-
92
-
93
-
94
-
95
-
96
-
97
-
98
-
99
-
100
-
101
-
102
-
103
-
104
-
105
-
106
-
107
-
108
-
109
-
110
-
111
-
112
-
113
-
114
-
115
-
116
-
117
-
118
-
119
-
120
-
121
-
122
-
123
-
124
-
125
-
126
-
127
-
128
-
129
-
130
-
131
-
132
-
133
-
134
-
135
-
136
-
137
-
138
-
139
-
140
-
141
-
142
-
143
-
144
-
145
-
146
-
147
-
148
-
149
-
150
-
151
-
152
-
153
-
154
-
155
-
156
-
157
-
158
-
159
-
160
-
161
-
162
-
163
-
164
-
165
-
166
-
167
-
168
-
169
-
170
-
171
-
172
-
173
-
174
-
175
-
176
-
177
-
178
-
179
-
180
-
181
-
182
-
183
-
184
-
185
-
186
-
187
-
188
-
189
-
190
-
191
-
192
-
193
-
194
-
195
-
196
-
197
-
198
-
199
-
200
-
201
-
202
-
203
-
204
-
205
-
206
-
207
-
208
-
209
-
210
-
211
 |
 |

Table of Contents
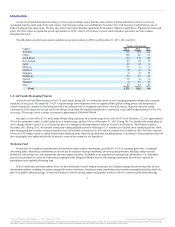
The table below sets forth our restaurant portfolio in our major markets in EMEA as of December 31, 2013, 2012 and 2011:
Germany 692 684 678
Spain 561 522 484
Turkey 553 486 408
UK 484 473 469
Russia 174 86 39
Italy 107 91 72
Saudi Arabia 95 80 64
Sweden 90 79 71
UAE 74 68 60
Kuwait 73 64 61
Netherlands 58 56 54
Portugal 39 38 38
Austria 37 34 31
Switzerland 37 31 32
Norway 35 32 32
Other 341 297 289
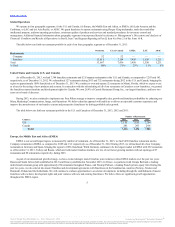
As of December 31, 2013, we had 1,550 franchise and no Company restaurants in LAC, as compared to 1,290 and 100, respectively, as of
December 31, 2012. In April 2013, we contributed all of our 98 Company restaurants in Mexico to a joint venture with Alsea S.A.B. de C.V., the parent of our
largest franchisee in Mexico, in exchange for cash and a 20.0% equity stake in the joint venture and granted the joint venture exclusive master franchise and
development rights. Brazil, where we established a master franchise joint venture in 2011, is one of our fastest growing markets, with net restaurant openings
of 93 in 2013.
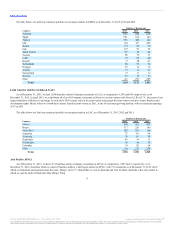
The table below sets forth our restaurant portfolio in our major markets in LAC as of December 31, 2013, 2012 and 2011:
Mexico 449 431 415
Brazil 317 224 140
Puerto Rico 185 183 180
Argentina 72 65 58
Venezuela 70 63 54
Guatemala 45 44 43
El Salvador 40 40 38
Colombia 38 28 18
Other 334 312 276
As of December 31, 2013, we had 1,231 franchise and no Company restaurants in APAC, as compared to 1,007 and 3, respectively, as of
December 31, 2012. Australia, which is a master franchise market, is the largest market in APAC, with 371 restaurants as of December 31, 2013, all of
which are franchised and operated under the name Hungry Jack’s®, a brand that we own in Australia and New Zealand. Australia is the only market in
which we operate under a brand other than Burger King.
6
Source: Burger King Worldwide, Inc., 10-K, February 21, 2014 Powered by Morningstar® Document Research℠
The information contained herein may not be copied, adapted or distributed and is not warranted to be accurate, complete or timely. The user assumes all risks for any damages or losses arising from any use of this
information, except to the extent such damages or losses cannot be limited or excluded by applicable law. Past financial performance is no guarantee of future results.