Burger King 2013 Annual Report Download - page 42
Download and view the complete annual report
Please find page 42 of the 2013 Burger King annual report below. You can navigate through the pages in the report by either clicking on the pages listed below, or by using the keyword search tool below to find specific information within the annual report.-
 1
1 -
2
-
3
-
4
-
5
-
6
-
7
-
8
-
9
-
10
-
11
-
12
-
13
-
14
-
15
-
16
-
17
-
18
-
19
-
20
-
21
-
22
-
23
-
24
-
25
-
26
-
27
-
28
-
29
-
30
-
31
-
 32
32 -
 33
33 -
 34
34 -
 35
35 -
 36
36 -
 37
37 -
 38
38 -
 39
39 -
 40
40 -
 41
41 -
 42
42 -
 43
43 -
 44
44 -
 45
45 -
 46
46 -
 47
47 -
 48
48 -
 49
49 -
 50
50 -
 51
51 -
 52
52 -
53
-
54
-
55
-
56
-
57
-
58
-
59
-
60
-
61
-
62
-
63
-
64
-
65
-
66
-
67
-
68
-
69
-
70
-
71
-
72
-
73
-
74
-
75
-
76
-
77
-
78
-
79
-
80
-
81
-
82
-
83
-
84
-
85
-
86
-
87
-
88
-
89
-
90
-
91
-
92
-
93
-
94
-
95
-
96
-
97
-
98
-
99
-
100
-
101
-
102
-
103
-
104
-
105
-
106
-
107
-
108
-
109
-
110
-
111
-
112
-
113
-
114
-
115
-
116
-
117
-
118
-
119
-
120
-
121
-
122
-
123
-
124
-
125
-
126
-
127
-
128
-
129
-
130
-
131
-
132
-
133
-
134
-
135
-
136
-
137
-
138
-
139
-
140
-
141
-
142
-
143
-
144
-
145
-
146
-
147
-
148
-
149
-
150
-
151
-
152
-
153
-
154
-
155
-
156
-
157
-
158
-
159
-
160
-
161
-
162
-
163
-
164
-
165
-
166
-
167
-
168
-
169
-
170
-
171
-
172
-
173
-
174
-
175
-
176
-
177
-
178
-
179
-
180
-
181
-
182
-
183
-
184
-
185
-
186
-
187
-
188
-
189
-
190
-
191
-
192
-
193
-
194
-
195
-
196
-
197
-
198
-
199
-
200
-
201
-
202
-
203
-
204
-
205
-
206
-
207
-
208
-
209
-
210
-
211
 |
 |

Table of Contents
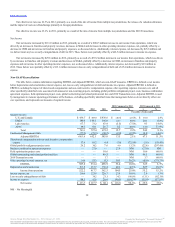
Adjusted EBITDA in 2013 reflects increases in segment income in our EMEA and APAC segments, partially offset by decreases in segment income in
our U.S. and Canada and LAC segments and an increase in Unallocated Management G&A. Unallocated Management G&A represents corporate support
costs in areas such as facilities, finance, human resources, information technology, legal, marketing and supply chain management, which benefit all of our
geographic segments and system-wide restaurants and are not allocated specifically to any of the geographic segments. EBITDA for 2013 increased primarily
for the same reasons that Adjusted EBITDA increased as well as the non-recurrence of Business Combination Agreement expenses, decreases in other operating
(income) expenses, net and decreases in global portfolio realignment project costs, partially offset by an increase in share-based compensation and non-cash
incentive compensation expense.
The increase in Adjusted EBITDA in 2012 was primarily driven by increases in segment income in all of our operating segments and reductions in
Unallocated Management G&A. EBITDA for 2012 increased primarily for the same reasons that consolidated adjusted EBITDA increased as well as the non-
recurrence of global restructuring and related professional fees, field optimization project costs and 2010 Transaction costs, partially offset by Business
Combination Agreement expenses in 2012, increases in global portfolio realignment project costs and increases in other operating (income) expenses, net.
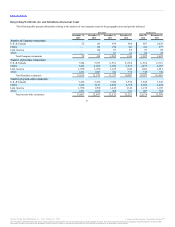
Company:
Company restaurant revenues $ 111.2 $792.8 $1,172.0 $ (681.6) $ (379.2)
CRM 13.5 90.1 142.2 (76.6) (52.1)
CRM % 12.1% 11.4% 12.1% 0.8% (0.8)%
Company restaurant expenses as a % of Company restaurant
revenues:
Food and paper 32.6% 33.0% 32.3% 0.4% (0.7)%
Payroll and benefits 29.9% 30.5% 30.4% 0.6% (0.1)%
Depreciation and amortization 5.2% 5.5% 5.7% 0.3% 0.2%
Other occupancy and operating 20.2% 19.6% 19.5% (0.6)% (0.1)%
Franchise:
Franchise and property revenues $ 554.0 $ 472.8 $ 401.3 $ 81.2 $ 71.5
Franchise and property expenses 119.8 82.8 73.0 (37.0) (9.8)
Segment SG&A (1) 52.5 101.9 120.1 49.4 18.2
Segment depreciation and amortization 41.5 68.8 86.2 27.3 17.4
Segment income 436.7 447.0 436.6 (10.3) 10.4
(1) Segment selling, general and administrative expenses (“Segment SG&A”) consists of segment selling expenses and Management G&A.
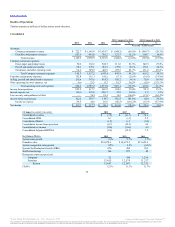
Favorable/(Unfavorable)
Segment revenues $ (1.3) $ (1.7) $ 6.5
Segment CRM (0.1) (0.2) 0.6
Segment income (0.7) (0.3) 1.0
System-wide sales growth (0.9)% 3.0% (3.3)%
Franchise sales $8,730.4 $8,143.9 $7,510.5
System comparable sales growth (0.9)% 3.5% (3.4)%
System NRG (40) (24) (50)
Net Refranchisings 127 752 38
Restaurant counts at period end
Company 52 183 939
Franchise 7,384 7,293 6,561
System 7,436 7,476 7,500
40
Source: Burger King Worldwide, Inc., 10-K, February 21, 2014 Powered by Morningstar® Document Research℠
The information contained herein may not be copied, adapted or distributed and is not warranted to be accurate, complete or timely. The user assumes all risks for any damages or losses arising from any use of this
information, except to the extent such damages or losses cannot be limited or excluded by applicable law. Past financial performance is no guarantee of future results.