Burger King 2013 Annual Report Download - page 7
Download and view the complete annual report
Please find page 7 of the 2013 Burger King annual report below. You can navigate through the pages in the report by either clicking on the pages listed below, or by using the keyword search tool below to find specific information within the annual report.-
 1
1 -
 2
2 -
 3
3 -
 4
4 -
 5
5 -
 6
6 -
 7
7 -
 8
8 -
 9
9 -
 10
10 -
 11
11 -
 12
12 -
 13
13 -
 14
14 -
 15
15 -
 16
16 -
 17
17 -
 18
18 -
19
-
20
-
21
-
22
-
23
-
24
-
25
-
26
-
27
-
28
-
29
-
30
-
31
-
32
-
33
-
34
-
35
-
36
-
37
-
38
-
39
-
40
-
41
-
42
-
43
-
44
-
45
-
46
-
47
-
48
-
49
-
50
-
51
-
52
-
53
-
54
-
55
-
56
-
57
-
58
-
59
-
60
-
61
-
62
-
63
-
64
-
65
-
66
-
67
-
68
-
69
-
70
-
71
-
72
-
73
-
74
-
75
-
76
-
77
-
78
-
79
-
80
-
81
-
82
-
83
-
84
-
85
-
86
-
87
-
88
-
89
-
90
-
91
-
92
-
93
-
94
-
95
-
96
-
97
-
98
-
99
-
100
-
101
-
102
-
103
-
104
-
105
-
106
-
107
-
108
-
109
-
110
-
111
-
112
-
113
-
114
-
115
-
116
-
117
-
118
-
119
-
120
-
121
-
122
-
123
-
124
-
125
-
126
-
127
-
128
-
129
-
130
-
131
-
132
-
133
-
134
-
135
-
136
-
137
-
138
-
139
-
140
-
141
-
142
-
143
-
144
-
145
-
146
-
147
-
148
-
149
-
150
-
151
-
152
-
153
-
154
-
155
-
156
-
157
-
158
-
159
-
160
-
161
-
162
-
163
-
164
-
165
-
166
-
167
-
168
-
169
-
170
-
171
-
172
-
173
-
174
-
175
-
176
-
177
-
178
-
179
-
180
-
181
-
182
-
183
-
184
-
185
-
186
-
187
-
188
-
189
-
190
-
191
-
192
-
193
-
194
-
195
-
196
-
197
-
198
-
199
-
200
-
201
-
202
-
203
-
204
-
205
-
206
-
207
-
208
-
209
-
210
-
211
 |
 |

Table of Contents
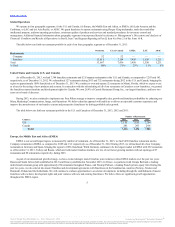
We operate in four geographic segments: (i) the U.S. and Canada; (ii) Europe, the Middle East and Africa, or EMEA; (iii) Latin America and the
Caribbean, or LAC and (iv) Asia Pacific, or APAC. We grant franchises to operate restaurants using Burger King trademarks, trade dress and other
intellectual property, uniform operating procedures, consistent quality of products and services and standard procedures for inventory control and
management. Additional financial information about geographic segments is incorporated herein by reference to Management’s Discussion and Analysis of
Financial Condition and Results of Operations in Part II, Item 7 and Segment Reporting in Part II, Item 8 in Note 21 of this Form 10-K.
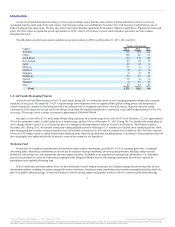
The table below sets forth our restaurant portfolio in each of our four geographic segments as of December 31, 2013:
Company 52 52 — — —
Franchise 13,615 7,384 3,450 1,550 1,231
Total 13,667 7,436 3,450 1,550 1,231
% Total 100% 55% 25% 11% 9%
As of December 31, 2013, we had 7,384 franchise restaurants and 52 Company restaurants in the U.S. and Canada, as compared to 7,293 and 183,
respectively, as of December 31, 2012. We refranchised 127 restaurants during 2013 and 752 restaurants during 2012 in the U.S. and Canada, bringing the
region to approximately 100% franchised as of December 31, 2013. We continue to own and operate 52 restaurants in Miami, Florida, which we expect to use
as a base for the testing of new products and systems. In connection with the refranchising of all of our restaurants in Canada to a new franchisee, we granted
the franchisee master franchise and development rights for Canada. We own 28.9% of Carrols Restaurant Group, Inc., our largest franchisee, and have two
seats on its board of directors.
During 2013, we also continued to implement our Four Pillars strategy to improve comparable sales growth and franchise profitability by enhancing our
Menu, Marketing Communications, Image, and Operations. We believe that this approach will enable us to deliver an enjoyable customer experience and
improve the attractiveness of our brand to current and prospective franchisees by driving profitable sales growth.
The table below sets forth our restaurant portfolio in the U.S. and Canada as of December 31, 2013, 2012 and 2011:
US 7,155 7,183 7,204
Canada 281 293 296
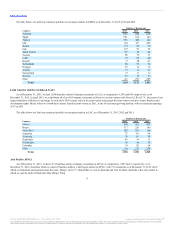
EMEA is our second largest region, as measured by number of restaurants. As of December 31, 2013, we had 3,450 franchise restaurants and no
Company restaurants in EMEA, as compared to 2,989 and 132, respectively, as of December 31, 2012. During 2013, we refranchised all of our Company
restaurants in Germany and Spain, bringing the region to 100% franchised. While Germany continues to be the largest market in EMEA with 692 restaurants
as of December 31, 2013, Turkey and Russia, which are both master franchise markets, are two of our fastest growing markets with net openings of 67
restaurants and 88 restaurants, respectively, during 2013.
As part of our international growth strategy, we have created strategic master franchise joint ventures in three EMEA markets over the past two years:
Russia and South Africa (both established in 2012) and France (established in November 2013). In France, we partnered with Groupe Bertrand, a leading
multi-brand restaurant group with approximately 250 restaurants throughout France, and Naxicap Partners, a leading French private equity firm. During the
past two years, we also entered into master franchise and development agreements with franchisees in the Scandinavian countries (Norway, Sweden and
Denmark), Finland and the Netherlands. We will continue to evaluate opportunities to accelerate development, including through the establishment of master
franchises with exclusive development rights and joint ventures with new and existing franchisees. We believe there are significant growth opportunities
throughout the EMEA region.
5
Source: Burger King Worldwide, Inc., 10-K, February 21, 2014 Powered by Morningstar® Document Research℠
The information contained herein may not be copied, adapted or distributed and is not warranted to be accurate, complete or timely. The user assumes all risks for any damages or losses arising from any use of this
information, except to the extent such damages or losses cannot be limited or excluded by applicable law. Past financial performance is no guarantee of future results.