Burger King 2013 Annual Report Download - page 96
Download and view the complete annual report
Please find page 96 of the 2013 Burger King annual report below. You can navigate through the pages in the report by either clicking on the pages listed below, or by using the keyword search tool below to find specific information within the annual report.-
 1
1 -
2
-
3
-
4
-
5
-
6
-
7
-
8
-
9
-
10
-
11
-
12
-
13
-
14
-
15
-
16
-
17
-
18
-
19
-
20
-
21
-
22
-
23
-
24
-
25
-
26
-
27
-
28
-
29
-
30
-
31
-
32
-
33
-
34
-
35
-
36
-
37
-
38
-
39
-
40
-
41
-
42
-
43
-
44
-
45
-
46
-
47
-
48
-
49
-
50
-
51
-
52
-
53
-
54
-
55
-
56
-
57
-
58
-
59
-
60
-
61
-
62
-
63
-
64
-
65
-
66
-
67
-
68
-
69
-
70
-
71
-
72
-
73
-
74
-
75
-
76
-
77
-
78
-
79
-
80
-
81
-
82
-
83
-
84
-
85
-
 86
86 -
 87
87 -
 88
88 -
 89
89 -
 90
90 -
 91
91 -
 92
92 -
 93
93 -
 94
94 -
 95
95 -
 96
96 -
 97
97 -
 98
98 -
 99
99 -
 100
100 -
 101
101 -
 102
102 -
 103
103 -
 104
104 -
 105
105 -
 106
106 -
107
-
108
-
109
-
110
-
111
-
112
-
113
-
114
-
115
-
116
-
117
-
118
-
119
-
120
-
121
-
122
-
123
-
124
-
125
-
126
-
127
-
128
-
129
-
130
-
131
-
132
-
133
-
134
-
135
-
136
-
137
-
138
-
139
-
140
-
141
-
142
-
143
-
144
-
145
-
146
-
147
-
148
-
149
-
150
-
151
-
152
-
153
-
154
-
155
-
156
-
157
-
158
-
159
-
160
-
161
-
162
-
163
-
164
-
165
-
166
-
167
-
168
-
169
-
170
-
171
-
172
-
173
-
174
-
175
-
176
-
177
-
178
-
179
-
180
-
181
-
182
-
183
-
184
-
185
-
186
-
187
-
188
-
189
-
190
-
191
-
192
-
193
-
194
-
195
-
196
-
197
-
198
-
199
-
200
-
201
-
202
-
203
-
204
-
205
-
206
-
207
-
208
-
209
-
210
-
211
 |
 |

Table of Contents
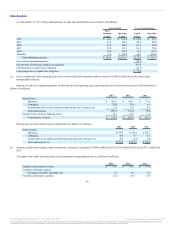
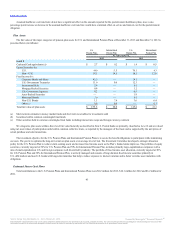
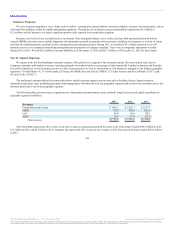
The U.S. and International Pension Plans’ and U.S. Retiree Medical Plan’s expected contributions to be paid in the next year, the projected benefit
payments for each of the next five years and the total aggregate amount for the subsequent five years are as follows (in millions):
Estimated Net Contributions During Year Ended 2014 $ 9.2 $ 0.3 $ 0.6
Estimated Future Year Benefit Payments During Years Ended:
2014 $ 8.8 $ 0.2 $ 0.6
2015 $ 9.2 $ 0.2 $ 0.6
2016 $ 9.5 $ 0.2 $ 0.5
2017 $ 9.9 $ 0.2 $ 0.5
2018 $ 10.2 $ 0.2 $ 0.5
2019 - 2023 $ 61.2 $ 2.2 $ 2.9
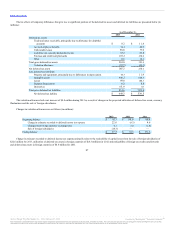
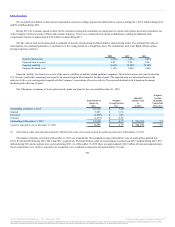
The following table presents financial assets and liabilities measured at fair value on a recurring basis as of December 31, 2013 and December 31, 2012
(in millions):
Derivatives designated as cash flow hedges:
Interest rate caps Other assets, net $ — $ 4.2 $ 4.2 $ — $ 4.3 $ 4.3
Forward-starting interest rate swaps Other assets, net — 169.9 169.9 — 0.8 0.8
Other:
Investments held in a rabbi trust Other assets, net 8.9 — 8.9 6.3 — 6.3
Total assets at fair value $8.9 $174.1 $183.0 $ 6.3 $5.1 $11.4
Derivatives designated as net investment hedges:
Cross-currency rate swaps Other liabilities, net $ — $25.9 $25.9 $ — $11.0 $11.0
Other:
ERP liabilities Other accrued liabilities — 2.8 2.8 — 4.4 4.4
ERP liabilities Other liabilities, net — 6.0 6.0 — 7.8 7.8
Total liabilities at fair value $ — $34.7 $34.7 $ — $23.2 $23.2
Our derivatives are valued using a discounted cash flow analysis that incorporates observable market parameters, such as interest rate yield curves and
currency rates, classified as Level 2 within the valuation hierarchy. Derivative valuations incorporate credit risk adjustments that are necessary to reflect the
probability of default by us or the counterparty.
Investments held in a rabbi trust consist of money market funds and mutual funds and the fair value measurements are derived using quoted prices in
active markets for the specific funds which are based on Level 1 inputs of the fair value hierarchy. The fair value measurements of the ERP liabilities are
derived principally from observable market data which are based on Level 2 inputs of the fair value hierarchy.
94
Source: Burger King Worldwide, Inc., 10-K, February 21, 2014 Powered by Morningstar® Document Research℠
The information contained herein may not be copied, adapted or distributed and is not warranted to be accurate, complete or timely. The user assumes all risks for any damages or losses arising from any use of this
information, except to the extent such damages or losses cannot be limited or excluded by applicable law. Past financial performance is no guarantee of future results.