Burger King 2013 Annual Report Download - page 92
Download and view the complete annual report
Please find page 92 of the 2013 Burger King annual report below. You can navigate through the pages in the report by either clicking on the pages listed below, or by using the keyword search tool below to find specific information within the annual report.-
 1
1 -
2
-
3
-
4
-
5
-
6
-
7
-
8
-
9
-
10
-
11
-
12
-
13
-
14
-
15
-
16
-
17
-
18
-
19
-
20
-
21
-
22
-
23
-
24
-
25
-
26
-
27
-
28
-
29
-
30
-
31
-
32
-
33
-
34
-
35
-
36
-
37
-
38
-
39
-
40
-
41
-
42
-
43
-
44
-
45
-
46
-
47
-
48
-
49
-
50
-
51
-
52
-
53
-
54
-
55
-
56
-
57
-
58
-
59
-
60
-
61
-
62
-
63
-
64
-
65
-
66
-
67
-
68
-
69
-
70
-
71
-
72
-
73
-
74
-
75
-
76
-
77
-
78
-
79
-
80
-
81
-
 82
82 -
 83
83 -
 84
84 -
 85
85 -
 86
86 -
 87
87 -
 88
88 -
 89
89 -
 90
90 -
 91
91 -
 92
92 -
 93
93 -
 94
94 -
 95
95 -
 96
96 -
 97
97 -
 98
98 -
 99
99 -
 100
100 -
 101
101 -
 102
102 -
103
-
104
-
105
-
106
-
107
-
108
-
109
-
110
-
111
-
112
-
113
-
114
-
115
-
116
-
117
-
118
-
119
-
120
-
121
-
122
-
123
-
124
-
125
-
126
-
127
-
128
-
129
-
130
-
131
-
132
-
133
-
134
-
135
-
136
-
137
-
138
-
139
-
140
-
141
-
142
-
143
-
144
-
145
-
146
-
147
-
148
-
149
-
150
-
151
-
152
-
153
-
154
-
155
-
156
-
157
-
158
-
159
-
160
-
161
-
162
-
163
-
164
-
165
-
166
-
167
-
168
-
169
-
170
-
171
-
172
-
173
-
174
-
175
-
176
-
177
-
178
-
179
-
180
-
181
-
182
-
183
-
184
-
185
-
186
-
187
-
188
-
189
-
190
-
191
-
192
-
193
-
194
-
195
-
196
-
197
-
198
-
199
-
200
-
201
-
202
-
203
-
204
-
205
-
206
-
207
-
208
-
209
-
210
-
211
 |
 |

Table of Contents
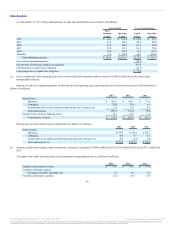
The following table sets forth the change in benefit obligations, fair value of plan assets and amounts recognized in the balance sheets for the
U.S. Pension Plans, International Pension Plans and U.S. Retiree Medical Plan (in millions):
Benefit obligation at beginning of year $ 212.9 $ 193.0 $ 8.5 $ 19.5
Service cost — — — —
Interest cost 8.4 8.6 0.4 0.4
Plan amendments — — — (11.1)
Actuarial (gains) losses (17.4) 21.0 (0.6) 0.1
Part D Rx Subsidy Received — — — 0.1
Benefits paid (10.3) (9.7) (0.4) (0.5)
Benefit obligation at end of year $193.6 $212.9 $7.9 $8.5
Fair value of plan assets at beginning of year $145.4 $ 129.0 $ — $ —
Actual return on plan assets 17.0 17.5 — —
Employer contributions 7.5 8.6 0.4 0.5
Benefits paid (10.3) (9.7) (0.4) (0.5)
Fair value of plan assets at end of year $159.6 $145.4 $ — $ —
Funded status of plan $(34.0) $(67.5) $ (7.9) $ (8.5)
Current liabilities $(0.8) $(0.7) $(0.5) $(0.5)
Noncurrent liabilities (33.2) (66.8) (7.4) (8.0)
Net pension liability, end of fiscal year $(34.0) $(67.5) $ (7.9) $ (8.5)
Prior service cost / (credit) $ — $ — $(12.4) $(15.3)
Unrecognized actuarial loss (gain) (2.9) 24.8 (2.1) (1.6)
Total AOCI (before tax) $ (2.9) $24.8 $(14.5) $(16.9)
90
Source: Burger King Worldwide, Inc., 10-K, February 21, 2014 Powered by Morningstar® Document Research℠
The information contained herein may not be copied, adapted or distributed and is not warranted to be accurate, complete or timely. The user assumes all risks for any damages or losses arising from any use of this
information, except to the extent such damages or losses cannot be limited or excluded by applicable law. Past financial performance is no guarantee of future results.