Burger King 2013 Annual Report Download - page 73
Download and view the complete annual report
Please find page 73 of the 2013 Burger King annual report below. You can navigate through the pages in the report by either clicking on the pages listed below, or by using the keyword search tool below to find specific information within the annual report.-
 1
1 -
2
-
3
-
4
-
5
-
6
-
7
-
8
-
9
-
10
-
11
-
12
-
13
-
14
-
15
-
16
-
17
-
18
-
19
-
20
-
21
-
22
-
23
-
24
-
25
-
26
-
27
-
28
-
29
-
30
-
31
-
32
-
33
-
34
-
35
-
36
-
37
-
38
-
39
-
40
-
41
-
42
-
43
-
44
-
45
-
46
-
47
-
48
-
49
-
50
-
51
-
52
-
53
-
54
-
55
-
56
-
57
-
58
-
59
-
60
-
61
-
62
-
 63
63 -
 64
64 -
 65
65 -
 66
66 -
 67
67 -
 68
68 -
 69
69 -
 70
70 -
 71
71 -
 72
72 -
 73
73 -
 74
74 -
 75
75 -
 76
76 -
 77
77 -
 78
78 -
 79
79 -
 80
80 -
 81
81 -
 82
82 -
 83
83 -
84
-
85
-
86
-
87
-
88
-
89
-
90
-
91
-
92
-
93
-
94
-
95
-
96
-
97
-
98
-
99
-
100
-
101
-
102
-
103
-
104
-
105
-
106
-
107
-
108
-
109
-
110
-
111
-
112
-
113
-
114
-
115
-
116
-
117
-
118
-
119
-
120
-
121
-
122
-
123
-
124
-
125
-
126
-
127
-
128
-
129
-
130
-
131
-
132
-
133
-
134
-
135
-
136
-
137
-
138
-
139
-
140
-
141
-
142
-
143
-
144
-
145
-
146
-
147
-
148
-
149
-
150
-
151
-
152
-
153
-
154
-
155
-
156
-
157
-
158
-
159
-
160
-
161
-
162
-
163
-
164
-
165
-
166
-
167
-
168
-
169
-
170
-
171
-
172
-
173
-
174
-
175
-
176
-
177
-
178
-
179
-
180
-
181
-
182
-
183
-
184
-
185
-
186
-
187
-
188
-
189
-
190
-
191
-
192
-
193
-
194
-
195
-
196
-
197
-
198
-
199
-
200
-
201
-
202
-
203
-
204
-
205
-
206
-
207
-
208
-
209
-
210
-
211
 |
 |

Table of Contents
Certain of our derivatives are valued using various pricing models or discounted cash flow analyses that incorporate observable market parameters,
such as interest rate yield curves and currency rates, classified as Level 2 within the valuation hierarchy. Derivative valuations incorporate credit risk
adjustments that are necessary to reflect the probability of default by the counterparty or us.
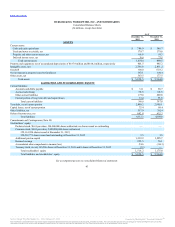
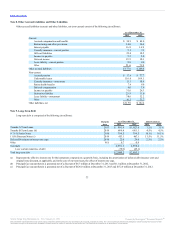
The carrying amounts for cash and equivalents, trade accounts and notes receivable and accounts and drafts payable approximate fair value based on
the short-term nature of these accounts.
Restricted investments, consisting of investment securities held in a rabbi trust to invest compensation deferred under our Executive Retirement Plan and
fund future deferred compensation obligations, are carried at fair value, with net unrealized gains and losses recorded in our consolidated statements of
operations. The fair value of these investment securities are determined using quoted market prices in active markets classified as Level 1 within the fair value
hierarchy.
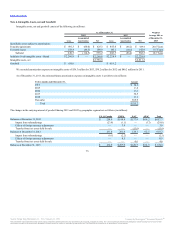
Fair value of variable rate term debt was estimated using inputs based on bid and offer prices and are Level 2 inputs within the fair value hierarchy.
Revenues include retail sales at Company restaurants, franchise revenues and property income. Franchise revenues consist primarily of royalties, based
on a percentage of sales reported by the franchise restaurants, and initial and renewal franchise fees paid by franchisees. Property income consists of operating
lease rentals and earned income on direct financing leases on property leased or subleased to franchisees. Retail sales at Company restaurants are recognized at
the point of sale. We present sales net of sales tax and other sales-related taxes. Royalties are based on a percentage of gross sales at franchise restaurants and
are recognized when earned and collectability is reasonably assured. Initial franchise fees are recognized as revenue when the related restaurant begins
operations. Fees collected in advance are deferred until earned. A franchisee may pay a renewal franchise fee and renew its franchise for an additional term.
Renewal franchise fees are recognized as revenue upon receipt of the non-refundable fee and execution of a new franchise agreement. Upfront fees paid by
franchisees in connection with development agreements are deferred when the development agreement includes a minimum number of restaurants to be opened
by the franchisee. The deferred amounts are recognized as franchise fee revenue on a pro rata basis as the franchisee opens each respective restaurant. The cost
recovery accounting method is used to recognize revenues for franchisees for which collectability is not reasonably assured. Rental income for base rentals is
recorded on a straight-line basis over the term of the lease and earned income on direct financing leases are recognized when earned and collectability is
reasonably assured. Contingent rent is recognized as earned, and any amounts received from lessees in advance of achieving stipulated thresholds are deferred
until such threshold is actually achieved.
Historically Company restaurants and franchise restaurants contribute to advertising funds that we manage in the United States and certain
international markets. Under our franchise agreements, advertising contributions received from franchisees must be spent on advertising, product
development, marketing and related activities. The advertising funds expense the production costs of advertising when the advertisements are first aired or
displayed. All other advertising and promotional costs are expensed in the period incurred. The revenues and expenses of the advertising funds are not included
in our consolidated statements of operations because we do not have complete discretion over the usage of the funds.
Advertising expense, which primarily consists of advertising contributions by Company restaurants based on a percentage of gross sales, totaled $6.2
million for 2013, $48.3 million for 2012 and $78.2 million for 2011 and is included in selling, general and administrative expenses in the accompanying
consolidated statements of operations.
As of the balance sheet date, contributions received may not equal advertising and promotional expenditures for the period due to the timing of
advertising promotions. To the extent that contributions received exceed advertising and promotional expenditures, the excess contributions are accounted for as
a deferred liability and are recorded in accrued advertising in the accompanying consolidated balance sheets. To the extent that advertising and promotional
expenditures temporarily exceed contributions received, the excess expenditures are accounted for as a receivable from the fund and are recorded in prepaids
and other current assets, net in the accompanying consolidated balance sheets.
In most of our international markets, franchisees contribute to advertising funds that are not managed by us. Such contributions and related fund
expenditures are not reflected in our results of operations or financial position.
71
Source: Burger King Worldwide, Inc., 10-K, February 21, 2014 Powered by Morningstar® Document Research℠
The information contained herein may not be copied, adapted or distributed and is not warranted to be accurate, complete or timely. The user assumes all risks for any damages or losses arising from any use of this
information, except to the extent such damages or losses cannot be limited or excluded by applicable law. Past financial performance is no guarantee of future results.