Burger King 2013 Annual Report Download - page 111
Download and view the complete annual report
Please find page 111 of the 2013 Burger King annual report below. You can navigate through the pages in the report by either clicking on the pages listed below, or by using the keyword search tool below to find specific information within the annual report.-
 1
1 -
2
-
3
-
4
-
5
-
6
-
7
-
8
-
9
-
10
-
11
-
12
-
13
-
14
-
15
-
16
-
17
-
18
-
19
-
20
-
21
-
22
-
23
-
24
-
25
-
26
-
27
-
28
-
29
-
30
-
31
-
32
-
33
-
34
-
35
-
36
-
37
-
38
-
39
-
40
-
41
-
42
-
43
-
44
-
45
-
46
-
47
-
48
-
49
-
50
-
51
-
52
-
53
-
54
-
55
-
56
-
57
-
58
-
59
-
60
-
61
-
62
-
63
-
64
-
65
-
66
-
67
-
68
-
69
-
70
-
71
-
72
-
73
-
74
-
75
-
76
-
77
-
78
-
79
-
80
-
81
-
82
-
83
-
84
-
85
-
86
-
87
-
88
-
89
-
90
-
91
-
92
-
93
-
94
-
95
-
96
-
97
-
98
-
99
-
100
-
 101
101 -
 102
102 -
 103
103 -
 104
104 -
 105
105 -
 106
106 -
 107
107 -
 108
108 -
 109
109 -
 110
110 -
 111
111 -
 112
112 -
 113
113 -
 114
114 -
 115
115 -
 116
116 -
 117
117 -
 118
118 -
 119
119 -
 120
120 -
 121
121 -
122
-
123
-
124
-
125
-
126
-
127
-
128
-
129
-
130
-
131
-
132
-
133
-
134
-
135
-
136
-
137
-
138
-
139
-
140
-
141
-
142
-
143
-
144
-
145
-
146
-
147
-
148
-
149
-
150
-
151
-
152
-
153
-
154
-
155
-
156
-
157
-
158
-
159
-
160
-
161
-
162
-
163
-
164
-
165
-
166
-
167
-
168
-
169
-
170
-
171
-
172
-
173
-
174
-
175
-
176
-
177
-
178
-
179
-
180
-
181
-
182
-
183
-
184
-
185
-
186
-
187
-
188
-
189
-
190
-
191
-
192
-
193
-
194
-
195
-
196
-
197
-
198
-
199
-
200
-
201
-
202
-
203
-
204
-
205
-
206
-
207
-
208
-
209
-
210
-
211
 |
 |

Table of Contents
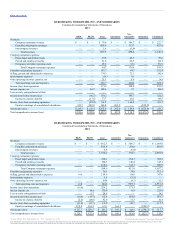
Condensed Consolidating Statements of Operations
Revenues:
Company restaurant revenues $ — $ — $ 76.0 $ — $ 146.7 $ — $ 222.7
Franchise and property revenues — — 609.9 — 313.7 — 923.6
Intercompany revenues — — 1.6 — (1.6) — —
Total revenues — — 687.5 — 458.8 — 1,146.3
Company restaurant expenses:
Food, paper and product costs — — 23.9 — 46.7 — 70.6
Payroll and employee benefits — — 21.6 — 46.5 — 68.1
Occupancy and other operating costs — — 19.2 — 37.4 — 56.6
Total Company restaurant expenses — — 64.7 — 130.6 — 195.3
Franchise and property expenses — — 107.7 — 44.7 — 152.4
Selling, general and administrative expenses — — 170.3 — 72.1 — 242.4
Intercompany expenses — — (4.1) — 4.1 — —
Other operating (income) expenses, net — — 25.1 — 8.9 — 34.0
Total operating costs and expenses — — 363.7 — 260.4 — 624.1
Income (loss) from operations — — 323.8 — 198.4 — 522.2
Interest expense, net — 46.7 149.6 — 3.7 — 200.0
Loss on early extinguishment of debt — — — — — — —
Income (loss) before income taxes — (46.7) 174.2 — 194.7 — 322.2
Income tax expense (benefit) — (17.5) 77.7 — 28.3 — 88.5
Income (loss) from continuing operations — (29.2) 96.5 — 166.4 — 233.7
Equity in earnings of consolidated subsidiaries 233.7 262.9 166.4 262.9 — (925.9) —
Net income (loss) $233.7 $233.7 $262.9 $262.9 $166.4 $(925.9) $233.7
Total comprehensive income (loss) $398.6 $398.6 $427.8 $427.8 $216.5 $(1,470.7) $398.6
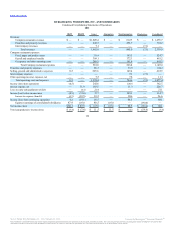
Condensed Consolidating Statements of Operations
Revenues:
Company restaurant revenues $ — $ — $ 662.5 $ — $ 506.5 $ — $ 1,169.0
Franchise and property revenues — — 528.9 — 273.0 — 801.9
Intercompany revenues — — 6.8 — (6.8) — —
Total revenues — — 1,198.2 — 772.7 — 1,970.9
Company restaurant expenses:
Food, paper and product costs — — 218.1 — 164.1 — 382.2
Payroll and employee benefits — — 198.3 — 146.8 — 345.1
Occupancy and other operating costs — — 168.2 — 141.7 — 309.9
Total Company restaurant expenses — — 584.6 — 452.6 — 1,037.2
Franchise and property expenses — — 76.3 — 38.8 — 115.1
Selling, general and administrative expenses 14.0 — 219.6 — 114.0 — 347.6
Intercompany expenses — — 5.5 — (5.5) — —
Other operating (income) expenses, net — — 54.0 — (0.7) — 53.3
Total operating costs and expenses 14.0 — 940.0 — 599.2 — 1,553.2
Income (loss) from operations (14.0) — 258.2 — 173.5 — 417.7
Interest expense, net — 44.0 170.9 — 8.9 — 223.8
Loss on early extinguishment of debt — 9.7 24.5 — — — 34.2
Income (loss) before income taxes (14.0) (53.7) 62.8 — 164.6 — 159.7
Income tax expense (benefit) (2.2) (20.0) 42.9 — 21.3 — 42.0
Income (loss) from continuing operations (11.8) (33.7) 19.9 — 143.3 — 117.7
Equity in earnings of consolidated subsidiaries 129.5 163.2 143.3 163.2 — (599.2) —
Net income (loss) $117.7 $129.5 $ 163.2 $ 163.2 $143.3 $(599.2) $117.7
Total comprehensive income (loss) $120.7 $ 132.5 $166.2 $166.2 $158.8 $(623.7) $120.7
Source: Burger King Worldwide, Inc., 10-K, February 21, 2014 Powered by Morningstar® Document Research℠
The information contained herein may not be copied, adapted or distributed and is not warranted to be accurate, complete or timely. The user assumes all risks for any damages or losses arising from any use of this
information, except to the extent such damages or losses cannot be limited or excluded by applicable law. Past financial performance is no guarantee of future results.