Burger King 2013 Annual Report Download - page 86
Download and view the complete annual report
Please find page 86 of the 2013 Burger King annual report below. You can navigate through the pages in the report by either clicking on the pages listed below, or by using the keyword search tool below to find specific information within the annual report.-
 1
1 -
2
-
3
-
4
-
5
-
6
-
7
-
8
-
9
-
10
-
11
-
12
-
13
-
14
-
15
-
16
-
17
-
18
-
19
-
20
-
21
-
22
-
23
-
24
-
25
-
26
-
27
-
28
-
29
-
30
-
31
-
32
-
33
-
34
-
35
-
36
-
37
-
38
-
39
-
40
-
41
-
42
-
43
-
44
-
45
-
46
-
47
-
48
-
49
-
50
-
51
-
52
-
53
-
54
-
55
-
56
-
57
-
58
-
59
-
60
-
61
-
62
-
63
-
64
-
65
-
66
-
67
-
68
-
69
-
70
-
71
-
72
-
73
-
74
-
75
-
 76
76 -
 77
77 -
 78
78 -
 79
79 -
 80
80 -
 81
81 -
 82
82 -
 83
83 -
 84
84 -
 85
85 -
 86
86 -
 87
87 -
 88
88 -
 89
89 -
 90
90 -
 91
91 -
 92
92 -
 93
93 -
 94
94 -
 95
95 -
 96
96 -
97
-
98
-
99
-
100
-
101
-
102
-
103
-
104
-
105
-
106
-
107
-
108
-
109
-
110
-
111
-
112
-
113
-
114
-
115
-
116
-
117
-
118
-
119
-
120
-
121
-
122
-
123
-
124
-
125
-
126
-
127
-
128
-
129
-
130
-
131
-
132
-
133
-
134
-
135
-
136
-
137
-
138
-
139
-
140
-
141
-
142
-
143
-
144
-
145
-
146
-
147
-
148
-
149
-
150
-
151
-
152
-
153
-
154
-
155
-
156
-
157
-
158
-
159
-
160
-
161
-
162
-
163
-
164
-
165
-
166
-
167
-
168
-
169
-
170
-
171
-
172
-
173
-
174
-
175
-
176
-
177
-
178
-
179
-
180
-
181
-
182
-
183
-
184
-
185
-
186
-
187
-
188
-
189
-
190
-
191
-
192
-
193
-
194
-
195
-
196
-
197
-
198
-
199
-
200
-
201
-
202
-
203
-
204
-
205
-
206
-
207
-
208
-
209
-
210
-
211
 |
 |

Table of Contents
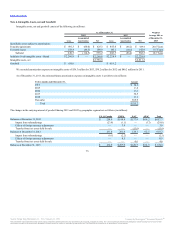
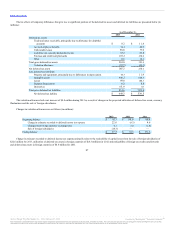
As of December 31, 2013, future minimum lease receipts and commitments were as follows (in millions):
2014 $ 24.1 $ 150.6 $ 22.6 $ 97.1
2015 23.5 145.3 20.9 90.8
2016 23.2 140.2 19.1 84.9
2017 22.4 137.1 16.9 78.6
2018 18.6 131.2 15.3 69.5
Thereafter 73.0 1,310.9 30.2 405.8
Total minimum payments $184.8 $2,015.3 $ 125.0 $826.7
Less amount representing interest (39.1)
Present value of minimum capital lease payments 85.9
Current portion of capital lease obligation (10.5)
Long-term portion of capital lease obligation $ 75.4
(a) Lease commitments under operating leases have not been reduced by minimum sublease rentals of $1,404.6 million due in the future under
noncancelable subleases.
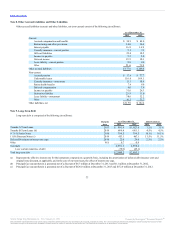
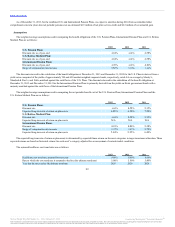
Property revenues are comprised primarily of rental income from operating leases and earned income on direct financing leases with franchisees as
follows (in millions):
Rental income:
Minimum $ 165.9 $ 108.1 $ 72.9
Contingent 25.0 17.4 0.3
Amortization of favorable and unfavorable income lease contracts, net 5.6 6.3 6.6
Total rental income 196.5 131.8 79.8
Earned income on direct financing leases 17.2 19.5 31.4
Total property revenues $213.7 $ 151.3 $111.2
Rent expense associated with the lease commitments is as follows (in millions):
Rental expense:
Minimum $115.0 $ 148.8 $167.3
Contingent 4.9 9.3 4.5
Amortization of favorable and unfavorable payable lease contracts, net 0.9 (2.4) (3.4)
Total rental expense (a) $120.8 $155.7 $168.4
(a) Amounts include rental expense related to properties subleased to franchisees of $94.0 million for 2013, $74.4 million for 2012 and $53.1 million for
2011.
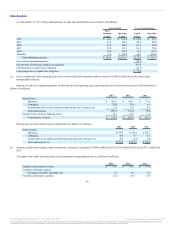
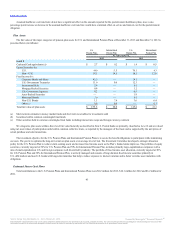
The impact of favorable and unfavorable lease amortization on operating income is as follows (in millions):
Franchise and property revenues $ 5.6 $ 6.3 $ 6.6
Company restaurant expenses:
Occupancy and other operating costs 1.3 3.4 4.1
Franchise and property expenses (2.1) (1.0) (0.7)
84
Source: Burger King Worldwide, Inc., 10-K, February 21, 2014 Powered by Morningstar® Document Research℠
The information contained herein may not be copied, adapted or distributed and is not warranted to be accurate, complete or timely. The user assumes all risks for any damages or losses arising from any use of this
information, except to the extent such damages or losses cannot be limited or excluded by applicable law. Past financial performance is no guarantee of future results.