Burger King 2013 Annual Report Download - page 64
Download and view the complete annual report
Please find page 64 of the 2013 Burger King annual report below. You can navigate through the pages in the report by either clicking on the pages listed below, or by using the keyword search tool below to find specific information within the annual report.-
 1
1 -
2
-
3
-
4
-
5
-
6
-
7
-
8
-
9
-
10
-
11
-
12
-
13
-
14
-
15
-
16
-
17
-
18
-
19
-
20
-
21
-
22
-
23
-
24
-
25
-
26
-
27
-
28
-
29
-
30
-
31
-
32
-
33
-
34
-
35
-
36
-
37
-
38
-
39
-
40
-
41
-
42
-
43
-
44
-
45
-
46
-
47
-
48
-
49
-
50
-
51
-
52
-
53
-
 54
54 -
 55
55 -
 56
56 -
 57
57 -
 58
58 -
 59
59 -
 60
60 -
 61
61 -
 62
62 -
 63
63 -
 64
64 -
 65
65 -
 66
66 -
 67
67 -
 68
68 -
 69
69 -
 70
70 -
 71
71 -
 72
72 -
 73
73 -
 74
74 -
75
-
76
-
77
-
78
-
79
-
80
-
81
-
82
-
83
-
84
-
85
-
86
-
87
-
88
-
89
-
90
-
91
-
92
-
93
-
94
-
95
-
96
-
97
-
98
-
99
-
100
-
101
-
102
-
103
-
104
-
105
-
106
-
107
-
108
-
109
-
110
-
111
-
112
-
113
-
114
-
115
-
116
-
117
-
118
-
119
-
120
-
121
-
122
-
123
-
124
-
125
-
126
-
127
-
128
-
129
-
130
-
131
-
132
-
133
-
134
-
135
-
136
-
137
-
138
-
139
-
140
-
141
-
142
-
143
-
144
-
145
-
146
-
147
-
148
-
149
-
150
-
151
-
152
-
153
-
154
-
155
-
156
-
157
-
158
-
159
-
160
-
161
-
162
-
163
-
164
-
165
-
166
-
167
-
168
-
169
-
170
-
171
-
172
-
173
-
174
-
175
-
176
-
177
-
178
-
179
-
180
-
181
-
182
-
183
-
184
-
185
-
186
-
187
-
188
-
189
-
190
-
191
-
192
-
193
-
194
-
195
-
196
-
197
-
198
-
199
-
200
-
201
-
202
-
203
-
204
-
205
-
206
-
207
-
208
-
209
-
210
-
211
 |
 |

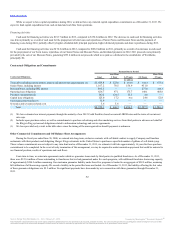
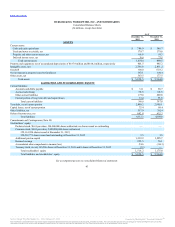
Table of Contents
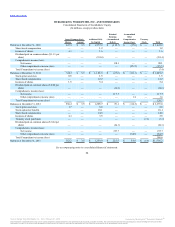
Consolidated Statements of Operations
(In millions, except per share data)
Revenues:
Company restaurant revenues $ 222.7 $1,169.0 $1,638.7
Franchise and property revenues 923.6 801.9 701.2
Total revenues 1,146.3 1,970.9 2,339.9
Company restaurant expenses:
Food, paper and product costs 70.6 382.2 524.7
Payroll and employee benefits 68.1 345.1 481.2
Occupancy and other operating costs 56.6 309.9 441.5
Total Company restaurant expenses 195.3 1,037.2 1,447.4
Franchise and property expenses 152.4 115.1 100.2
Selling, general and administrative expenses 242.4 347.6 418.5
Other operating (income) expenses, net 34.0 53.3 11.3
Total operating costs and expenses 624.1 1,553.2 1,977.4
Income from operations 522.2 417.7 362.5
Interest expense, net 200.0 223.8 226.7
Loss on early extinguishment of debt — 34.2 21.1
Income before income taxes 322.2 159.7 114.7
Income tax expense 88.5 42.0 26.6
Net income $233.7 $117.7 $ 88.1
Earnings per share:
Basic $ 0.67 $0.34 $ 0.25
Diluted $0.65 $0.33 $ 0.25
Weighted average shares outstanding
Basic 351.0 349.7 348.2
Diluted 357.8 354.1 348.2
Dividends per common share $0.24 $0.04 $1.13
See accompanying notes to consolidated financial statements.
62
Source: Burger King Worldwide, Inc., 10-K, February 21, 2014 Powered by Morningstar® Document Research℠
The information contained herein may not be copied, adapted or distributed and is not warranted to be accurate, complete or timely. The user assumes all risks for any damages or losses arising from any use of this
information, except to the extent such damages or losses cannot be limited or excluded by applicable law. Past financial performance is no guarantee of future results.