Burger King 2013 Annual Report Download - page 88
Download and view the complete annual report
Please find page 88 of the 2013 Burger King annual report below. You can navigate through the pages in the report by either clicking on the pages listed below, or by using the keyword search tool below to find specific information within the annual report.-
 1
1 -
2
-
3
-
4
-
5
-
6
-
7
-
8
-
9
-
10
-
11
-
12
-
13
-
14
-
15
-
16
-
17
-
18
-
19
-
20
-
21
-
22
-
23
-
24
-
25
-
26
-
27
-
28
-
29
-
30
-
31
-
32
-
33
-
34
-
35
-
36
-
37
-
38
-
39
-
40
-
41
-
42
-
43
-
44
-
45
-
46
-
47
-
48
-
49
-
50
-
51
-
52
-
53
-
54
-
55
-
56
-
57
-
58
-
59
-
60
-
61
-
62
-
63
-
64
-
65
-
66
-
67
-
68
-
69
-
70
-
71
-
72
-
73
-
74
-
75
-
76
-
77
-
 78
78 -
 79
79 -
 80
80 -
 81
81 -
 82
82 -
 83
83 -
 84
84 -
 85
85 -
 86
86 -
 87
87 -
 88
88 -
 89
89 -
 90
90 -
 91
91 -
 92
92 -
 93
93 -
 94
94 -
 95
95 -
 96
96 -
 97
97 -
 98
98 -
99
-
100
-
101
-
102
-
103
-
104
-
105
-
106
-
107
-
108
-
109
-
110
-
111
-
112
-
113
-
114
-
115
-
116
-
117
-
118
-
119
-
120
-
121
-
122
-
123
-
124
-
125
-
126
-
127
-
128
-
129
-
130
-
131
-
132
-
133
-
134
-
135
-
136
-
137
-
138
-
139
-
140
-
141
-
142
-
143
-
144
-
145
-
146
-
147
-
148
-
149
-
150
-
151
-
152
-
153
-
154
-
155
-
156
-
157
-
158
-
159
-
160
-
161
-
162
-
163
-
164
-
165
-
166
-
167
-
168
-
169
-
170
-
171
-
172
-
173
-
174
-
175
-
176
-
177
-
178
-
179
-
180
-
181
-
182
-
183
-
184
-
185
-
186
-
187
-
188
-
189
-
190
-
191
-
192
-
193
-
194
-
195
-
196
-
197
-
198
-
199
-
200
-
201
-
202
-
203
-
204
-
205
-
206
-
207
-
208
-
209
-
210
-
211
 |
 |

Table of Contents
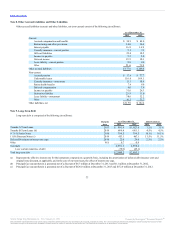
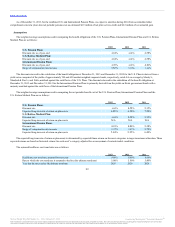
The U.S. Federal tax statutory rate reconciles to the effective tax rate as follows:
U.S. Federal income tax rate 35.0% 35.0% 35.0%
State income taxes, net of federal income tax benefit 0.5 1.0 1.0
Costs and taxes related to foreign operations 6.2 10.7 14.6
Foreign tax rate differential (14.6) (25.0) (26.2)
Foreign exchange differential on tax benefits — — (0.1)
Change in valuation allowance 0.6 (1.1) 3.8
Change in accrual for tax uncertainties 1.5 1.6 1.8
Deductible FTC (1.9) (3.2) (3.7)
Non Deductible Transaction Costs 0.3 2.5 (1.2)
Other (0.1) 4.8 (1.8)
Effective income tax rate 27.5% 26.3% 23.2%
Our effective tax rate was 27.5% for 2013, primarily as a result of the mix of income from multiple tax jurisdictions and the impact of non-deductible
expenses related to our refranchisings, partially offset by a favorable impact from the sale of a foreign subsidiary and a reduction in the state effective tax rate
related to our refranchisings. Our effective tax rate was 26.3% for 2012, primarily as a result of the mix of income from multiple tax jurisdictions, the release
of valuation allowance and the impact of costs on refranchisings primarily in foreign jurisdictions. Our effective tax rate was 23.2% for 2011, primarily as a
result of the exclusion of the tax benefit of foreign ordinary losses not expected to be realized, the mix of income from multiple tax jurisdictions and the
resolution of state tax audits.
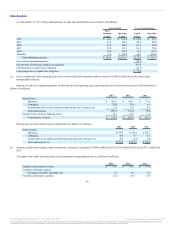
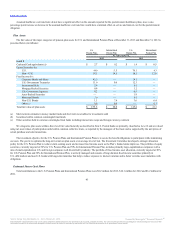
The following table provides the amount of income tax expense (benefit) allocated to continuing operations and amounts separately allocated to other
items (in millions):
Income tax expense from continuing operations $ 88.5 $ 42.0 $ 26.6
Interest rate caps in accumulated other comprehensive income (loss) 2.3 (2.1) (26.8)
Interest rate swaps in accumulated other comprehensive income (loss) 65.8 0.3 —
Pension liability in accumulated other comprehensive income (loss) 9.9 (1.2) (5.8)
Net investment hedge in accumulated other comprehensive income (loss) (5.7) (4.2) —
Stock option tax benefit in additional paid-in capital (10.1) — —
Total $ 150.7 $34.8 $(6.0)
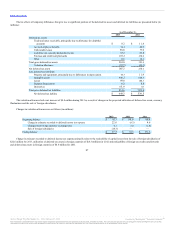
The significant components of deferred income tax expense (benefit) attributable to income from continuing operations are as follows (in millions):
Deferred income tax expense
(exclusive of the effects of components listed below) $ 9.9 $ 17.9 $ (11.1)
Change in valuation allowance 22.6 (8.3) 4.6
Change in effective state income tax rate (4.0) 0.8 —
Change in effective foreign income tax rate 3.6 (1.5) —
Total $32.1 $8.9 $(6.5)
86
Source: Burger King Worldwide, Inc., 10-K, February 21, 2014 Powered by Morningstar® Document Research℠
The information contained herein may not be copied, adapted or distributed and is not warranted to be accurate, complete or timely. The user assumes all risks for any damages or losses arising from any use of this
information, except to the extent such damages or losses cannot be limited or excluded by applicable law. Past financial performance is no guarantee of future results.