Burger King 2012 Annual Report Download - page 99
Download and view the complete annual report
Please find page 99 of the 2012 Burger King annual report below. You can navigate through the pages in the report by either clicking on the pages listed below, or by using the keyword search tool below to find specific information within the annual report.-
 1
1 -
2
-
3
-
4
-
5
-
6
-
7
-
8
-
9
-
10
-
11
-
12
-
13
-
14
-
15
-
16
-
17
-
18
-
19
-
20
-
21
-
22
-
23
-
24
-
25
-
26
-
27
-
28
-
29
-
30
-
31
-
32
-
33
-
34
-
35
-
36
-
37
-
38
-
39
-
40
-
41
-
42
-
43
-
44
-
45
-
46
-
47
-
48
-
49
-
50
-
51
-
52
-
53
-
54
-
55
-
56
-
57
-
58
-
59
-
60
-
61
-
62
-
63
-
64
-
65
-
66
-
67
-
68
-
69
-
70
-
71
-
72
-
73
-
74
-
75
-
76
-
77
-
78
-
79
-
80
-
81
-
82
-
83
-
84
-
85
-
86
-
87
-
88
-
 89
89 -
 90
90 -
 91
91 -
 92
92 -
 93
93 -
 94
94 -
 95
95 -
 96
96 -
 97
97 -
 98
98 -
 99
99 -
 100
100 -
 101
101 -
 102
102 -
 103
103 -
 104
104 -
 105
105 -
 106
106 -
 107
107 -
 108
108 -
 109
109 -
110
-
111
-
112
-
113
-
114
-
115
-
116
-
117
-
118
-
119
-
120
-
121
-
122
-
123
-
124
-
125
-
126
-
127
-
128
-
129
-
130
-
131
-
132
-
133
-
134
-
135
-
136
-
137
-
138
-
139
-
140
-
141
-
142
-
143
-
144
-
145
-
146
-
147
-
148
-
149
-
150
-
151
-
152
-
153
-
154
-
155
-
156
-
157
-
158
-
159
-
160
-
161
-
162
-
163
-
164
-
165
-
166
-
167
-
168
-
169
-
170
-
171
-
172
-
173
-
174
-
175
-
176
-
177
-
178
-
179
-
180
-
181
-
182
-
183
-
184
-
185
-
186
-
187
-
188
-
189
-
190
-
191
-
192
-
193
-
194
-
195
-
196
-
197
-
198
-
199
-
200
-
201
-
202
-
203
-
204
-
205
-
206
-
207
-
208
-
209
 |
 |

Table of Contents
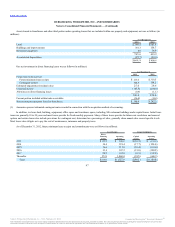
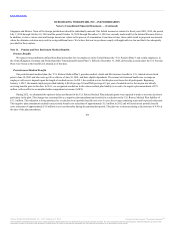
Our total minimum obligations under capital leases are $145.0 million as of December 31, 2012 and $157.6 million as of December 31, 2011
including $45.9 million as of December 31, 2012 and $52.9 million as of December 31, 2011 which represented future interest expense. The remaining
balance was capital lease obligations of $99.1 million as of December 31, 2012 and $104.7 million as of December 31, 2011 which are all recorded on our
consolidated balance sheet. Of these balances, $10.7 million was classified as current portion of long-term debt and capital leases as of December 31, 2012
and $9.3 million as of December 31, 2011.
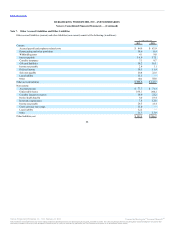
Property revenues are comprised primarily of rental income from operating leases and earned income on direct financing leases with franchisees as
follows (in millions):
Rental income:
Minimum $108.1 $72.9 $ 16.0 $21.9 $73.1
Contingent 17.4 0.3 — 4.9 17.9
Amortization of favorable and unfavorable income lease contracts, net 6.3 6.6 1.3 — —
Total rental income 131.8 79.8 17.3 26.8 91.0
Earned income on direct financing leases 19.5 31.4 6.2 7.2 22.7
Total property revenues $151.3 $111.2 $ 23.5 $34.0 $113.7
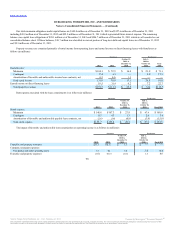
Rent expense associated with the lease commitments is as follows (in millions):
Rental expense:
Minimum $148.8 $167.3 $ 27.8 $47.4 $168.9
Contingent 9.3 4.5 1.3 2.0 7.4
Amortization of favorable and unfavorable payable lease contracts, net (2.4) (3.4) (0.9) (3.9) (15.0)
Total rental expense $155.7 $168.4 $ 28.2 $45.5 $ 161.3
The impact of favorable and unfavorable lease amortization on operating income is as follows (in millions):
Franchise and property revenues $ 6.3 $6.6 $1.3 $ — $ —
Company restaurant expenses:
Occupancy and other operating costs 3.4 4.1 1.0 2.6 10.4
Franchise and property expenses (1.0) (0.7) (0.1) 1.3 4.6
98
Source: Burger King Worldwide, Inc., 10-K, February 22, 2013 Powered by Morningstar® Document Research℠
The information contained herein may not be copied, adapted or distributed and is not warranted to be accurate, complete or timely. The user assumes all risks for any damages or losses arising from any use of this
information, except to the extent such damages or losses cannot be limited or excluded by applicable law. Past financial performance is no guarantee of future results.