Burger King 2012 Annual Report Download - page 138
Download and view the complete annual report
Please find page 138 of the 2012 Burger King annual report below. You can navigate through the pages in the report by either clicking on the pages listed below, or by using the keyword search tool below to find specific information within the annual report.-
 1
1 -
2
-
3
-
4
-
5
-
6
-
7
-
8
-
9
-
10
-
11
-
12
-
13
-
14
-
15
-
16
-
17
-
18
-
19
-
20
-
21
-
22
-
23
-
24
-
25
-
26
-
27
-
28
-
29
-
30
-
31
-
32
-
33
-
34
-
35
-
36
-
37
-
38
-
39
-
40
-
41
-
42
-
43
-
44
-
45
-
46
-
47
-
48
-
49
-
50
-
51
-
52
-
53
-
54
-
55
-
56
-
57
-
58
-
59
-
60
-
61
-
62
-
63
-
64
-
65
-
66
-
67
-
68
-
69
-
70
-
71
-
72
-
73
-
74
-
75
-
76
-
77
-
78
-
79
-
80
-
81
-
82
-
83
-
84
-
85
-
86
-
87
-
88
-
89
-
90
-
91
-
92
-
93
-
94
-
95
-
96
-
97
-
98
-
99
-
100
-
101
-
102
-
103
-
104
-
105
-
106
-
107
-
108
-
109
-
110
-
111
-
112
-
113
-
114
-
115
-
116
-
117
-
118
-
119
-
120
-
121
-
122
-
123
-
124
-
125
-
126
-
127
-
 128
128 -
 129
129 -
 130
130 -
 131
131 -
 132
132 -
 133
133 -
 134
134 -
 135
135 -
 136
136 -
 137
137 -
 138
138 -
 139
139 -
 140
140 -
 141
141 -
 142
142 -
 143
143 -
 144
144 -
 145
145 -
 146
146 -
 147
147 -
 148
148 -
149
-
150
-
151
-
152
-
153
-
154
-
155
-
156
-
157
-
158
-
159
-
160
-
161
-
162
-
163
-
164
-
165
-
166
-
167
-
168
-
169
-
170
-
171
-
172
-
173
-
174
-
175
-
176
-
177
-
178
-
179
-
180
-
181
-
182
-
183
-
184
-
185
-
186
-
187
-
188
-
189
-
190
-
191
-
192
-
193
-
194
-
195
-
196
-
197
-
198
-
199
-
200
-
201
-
202
-
203
-
204
-
205
-
206
-
207
-
208
-
209
 |
 |

Table of Contents
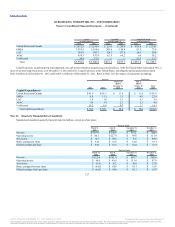
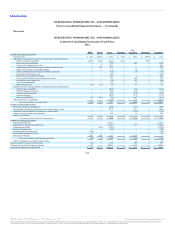
Net income (loss) $88.1 $87.9 $107.0 $107.0 $88.5 $(390.4) 88.1
Adjustments to reconcile net income to net cash provided by operating activities:
Equity in earnings of subsidiary (87.9) (107.0) (88.5) (107.0) — 390.4 —
Depreciation and amortization — — 91.2 — 45.2 — 136.4
(Gain) loss on early extinguishment of debt — (0.3) 21.4 — — — 21.1
Amortization of deferred financing cost and debt issuance discount — 31.8 14.5 — — — 46.3
Loss (gain) on remeasurement of foreign denominated transactions — — 0.6 — (0.2) — 0.4
Realized loss on terminated caps/swaps — — 0.5 — — — 0.5
(Gain) loss on refranchisings and dispositions of assets — — (4.1) — 3.1 — (1.0)
Impairment on non-restaurant properties — — 2.0 — 0.3 — 2.3
Bad debt expense, net of recoveries — — 6.0 — 0.1 — 6.1
Share-based compensation — — 4.7 — 1.7 — 6.4
Deferred income taxes — 3.1 (36.8) — 6.4 — (27.3)
Changes in current assets and liabilities, excluding acquisitions and dispositions:
Trade and notes receivables — — (9.6) — 3.6 — (6.0)
Prepaids and other current assets — — 96.4 — 9.1 — 105.5
Accounts and drafts payable — — 2.8 — 5.9 — 8.7
Accrued advertising — — 11.3 — 7.0 — 18.3
Other accrued liabilities — (2.4) 10.5 — 7.9 — 16.0
Other long-term assets and liabilities — (13.3) 12.3 — (9.7) (4.9) (15.6)
Net cash provided by (used for) operating activities 0.2 (0.2) 242.2 — 168.9 (4.9) 406.2
Payments for property and equipment — — (62.5) — (19.6) — (82.1)
Proceeds from refranchisings, disposition of assets and restaurant closures — — 15.6 — 14.3 — 29.9
Investments in / advances to unconsolidated entities — — — — (4.5) — (4.5)
Return of investment on direct financing leases — — 13.5 — 1.1 — 14.6
Other investing activities — — 0.7 — — — 0.7
Net cash (used for) investing activities — — (32.7) — (8.7) — (41.4)
Proceeds from term debt — — 1,860.0 — — — 1,860.0
Proceeds from discount notes — 401.5 — — — — 401.5
Repayments of term debt and capital leases — — (1,870.8) — (3.7) — (1,874.5)
Extinguishment of debt — (7.6) (63.0) — — — (70.6)
Payment of financing costs — (9.5) (23.1) — — — (32.6)
Proceeds from issuance of shares 1.6 — — — — — 1.6
Dividends paid on common stock (385.8) — (7.6) — — — (393.4)
Capital distribution from Parent — — 0.7 (0.7) — — —
Intercompany financing 384.2 (384.2) 43.6 — (48.5) 4.9 —
Net cash provided by (used for) financing activities — 0.2 (60.2) (0.7) (52.2) 4.9 (108.0)
Effect of exchange rates on cash and cash equivalents — — 5.0 — (9.8) — (4.8)
Increase (decrease) in cash and cash equivalents 0.2 (0.0) 154.3 (0.7) 98.2 (0.0) 252.0
Cash and cash equivalents at beginning of period — — 132.8 0.7 73.5 — 207.0
$0.2 $(0.0) $287.1 $— $171.7 $(0.0) $459.0
137
Source: Burger King Worldwide, Inc., 10-K, February 22, 2013 Powered by Morningstar® Document Research℠
The information contained herein may not be copied, adapted or distributed and is not warranted to be accurate, complete or timely. The user assumes all risks for any damages or losses arising from any use of this
information, except to the extent such damages or losses cannot be limited or excluded by applicable law. Past financial performance is no guarantee of future results.