Burger King 2012 Annual Report Download - page 128
Download and view the complete annual report
Please find page 128 of the 2012 Burger King annual report below. You can navigate through the pages in the report by either clicking on the pages listed below, or by using the keyword search tool below to find specific information within the annual report.-
 1
1 -
2
-
3
-
4
-
5
-
6
-
7
-
8
-
9
-
10
-
11
-
12
-
13
-
14
-
15
-
16
-
17
-
18
-
19
-
20
-
21
-
22
-
23
-
24
-
25
-
26
-
27
-
28
-
29
-
30
-
31
-
32
-
33
-
34
-
35
-
36
-
37
-
38
-
39
-
40
-
41
-
42
-
43
-
44
-
45
-
46
-
47
-
48
-
49
-
50
-
51
-
52
-
53
-
54
-
55
-
56
-
57
-
58
-
59
-
60
-
61
-
62
-
63
-
64
-
65
-
66
-
67
-
68
-
69
-
70
-
71
-
72
-
73
-
74
-
75
-
76
-
77
-
78
-
79
-
80
-
81
-
82
-
83
-
84
-
85
-
86
-
87
-
88
-
89
-
90
-
91
-
92
-
93
-
94
-
95
-
96
-
97
-
98
-
99
-
100
-
101
-
102
-
103
-
104
-
105
-
106
-
107
-
108
-
109
-
110
-
111
-
112
-
113
-
114
-
115
-
116
-
117
-
 118
118 -
 119
119 -
 120
120 -
 121
121 -
 122
122 -
 123
123 -
 124
124 -
 125
125 -
 126
126 -
 127
127 -
 128
128 -
 129
129 -
 130
130 -
 131
131 -
 132
132 -
 133
133 -
 134
134 -
 135
135 -
 136
136 -
 137
137 -
 138
138 -
139
-
140
-
141
-
142
-
143
-
144
-
145
-
146
-
147
-
148
-
149
-
150
-
151
-
152
-
153
-
154
-
155
-
156
-
157
-
158
-
159
-
160
-
161
-
162
-
163
-
164
-
165
-
166
-
167
-
168
-
169
-
170
-
171
-
172
-
173
-
174
-
175
-
176
-
177
-
178
-
179
-
180
-
181
-
182
-
183
-
184
-
185
-
186
-
187
-
188
-
189
-
190
-
191
-
192
-
193
-
194
-
195
-
196
-
197
-
198
-
199
-
200
-
201
-
202
-
203
-
204
-
205
-
206
-
207
-
208
-
209
 |
 |

Table of Contents
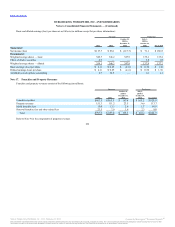
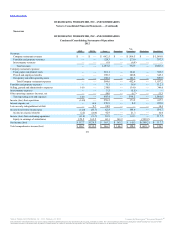
United States and Canada $ 3,472.5 $ 3,534.9 $231.0 $ 254.8 $938.6 $1,114.1
EMEA 1,383.9 1,368.4 201.6 198.8 55.3 73.9
LAC 189.9 189.7 124.1 137.9 20.0 28.8
APAC 459.3 457.8 62.5 66.2 0.4 19.2
Unallocated 58.4 57.6 — — 51.3 32.7
Total $5,564.0 $5,608.4 $619.2 $657.7 $1,065.6 $1,268.7
Long-lived assets include property and equipment, net, and net investment in property leased to franchisees. Only the United States represented 10% or
more of our total long-lived assets as of December 31, 2012 and 2011. Long-lived assets in the United States, including the unallocated portion, totaled
$921.6 million as of December 31, 2012 and $1,069.3 million as of December 31, 2011. Refer to Note 1 for the impact of acquisition accounting.
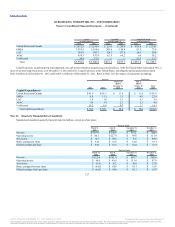
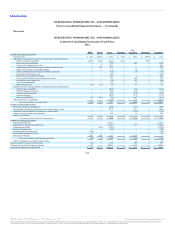
United States and Canada $ 41.9 $56.5 $17.4 $11.0 $99.9
EMEA 6.9 11.1 3.3 0.9 22.9
LAC 1.4 1.8 1.1 0.3 5.4
APAC 0.8 3.8 2.1 2.3 8.0
Unallocated 19.2 8.9 4.5 3.7 14.1
Total capital expenditures $70.2 $ 82.1 $28.4 $ 18.2 $150.3
Summarized unaudited quarterly financial data (in millions, except per share data):
Revenue $569.9 $540.8 $ 451.1 $404.5
Operating income $84.1 $127.9 $ 93.8 $111.9
Net income $14.3 $48.2 $6.6 $ 48.6
Basic earnings per share $0.04 $0.14 $0.02 $0.14
Diluted earnings per share $0.04 $0.14 $0.02 $0.14
Revenue $552.0 $595.4 $ 607.7 $580.6
Operating income $64.0 $99.0 $111.6 $87.9
Net income $(5.9) $30.2 $38.8 $ 25.0
Basic earnings (loss) per share $(0.02) $0.09 $0.11 $0.07
Diluted earnings (loss) per share $(0.02) $0.09 $0.11 $0.07
127
Source: Burger King Worldwide, Inc., 10-K, February 22, 2013 Powered by Morningstar® Document Research℠
The information contained herein may not be copied, adapted or distributed and is not warranted to be accurate, complete or timely. The user assumes all risks for any damages or losses arising from any use of this
information, except to the extent such damages or losses cannot be limited or excluded by applicable law. Past financial performance is no guarantee of future results.