Burger King 2012 Annual Report Download - page 120
Download and view the complete annual report
Please find page 120 of the 2012 Burger King annual report below. You can navigate through the pages in the report by either clicking on the pages listed below, or by using the keyword search tool below to find specific information within the annual report.-
 1
1 -
2
-
3
-
4
-
5
-
6
-
7
-
8
-
9
-
10
-
11
-
12
-
13
-
14
-
15
-
16
-
17
-
18
-
19
-
20
-
21
-
22
-
23
-
24
-
25
-
26
-
27
-
28
-
29
-
30
-
31
-
32
-
33
-
34
-
35
-
36
-
37
-
38
-
39
-
40
-
41
-
42
-
43
-
44
-
45
-
46
-
47
-
48
-
49
-
50
-
51
-
52
-
53
-
54
-
55
-
56
-
57
-
58
-
59
-
60
-
61
-
62
-
63
-
64
-
65
-
66
-
67
-
68
-
69
-
70
-
71
-
72
-
73
-
74
-
75
-
76
-
77
-
78
-
79
-
80
-
81
-
82
-
83
-
84
-
85
-
86
-
87
-
88
-
89
-
90
-
91
-
92
-
93
-
94
-
95
-
96
-
97
-
98
-
99
-
100
-
101
-
102
-
103
-
104
-
105
-
106
-
107
-
108
-
109
-
 110
110 -
 111
111 -
 112
112 -
 113
113 -
 114
114 -
 115
115 -
 116
116 -
 117
117 -
 118
118 -
 119
119 -
 120
120 -
 121
121 -
 122
122 -
 123
123 -
 124
124 -
 125
125 -
 126
126 -
 127
127 -
 128
128 -
 129
129 -
 130
130 -
131
-
132
-
133
-
134
-
135
-
136
-
137
-
138
-
139
-
140
-
141
-
142
-
143
-
144
-
145
-
146
-
147
-
148
-
149
-
150
-
151
-
152
-
153
-
154
-
155
-
156
-
157
-
158
-
159
-
160
-
161
-
162
-
163
-
164
-
165
-
166
-
167
-
168
-
169
-
170
-
171
-
172
-
173
-
174
-
175
-
176
-
177
-
178
-
179
-
180
-
181
-
182
-
183
-
184
-
185
-
186
-
187
-
188
-
189
-
190
-
191
-
192
-
193
-
194
-
195
-
196
-
197
-
198
-
199
-
200
-
201
-
202
-
203
-
204
-
205
-
206
-
207
-
208
-
209
 |
 |

Table of Contents
Additionally, the Predecessor was required to estimate pre-vesting forfeitures for purposes of determining compensation expense to be recognized. Future
expense amounts for any quarterly or annual period could have been affected by changes in the Predecessor’s assumptions or changes in market conditions.
The Predecessor determined the expected term of stock options granted using the simplified method. Based on the results of applying the simplified
method, the Predecessor determined that 6.25 years was an appropriate expected term for awards with four-year graded vesting.
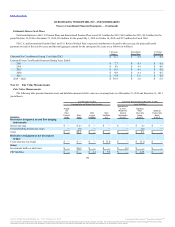
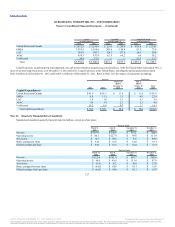
The fair value of each stock option granted under the Plans during July 1, 2010 through October 18, 2010 and for Fiscal 2010 and 2009 was estimated
on the date of grant using the Black-Scholes option pricing model based on the following weighted-average assumptions:
Risk-free interest rate 1.83% 2.92%
Expected term (in years) 6.25 6.25
Expected volatility 38.34% 37.15%
Expected dividend yield 1.43% 1.37%
The weighted average grant date fair value of stock options granted was $6.02 during the period July 1, 2010 through October 18, 2010 and $6.56 for
Fiscal 2010. The total intrinsic value of stock options exercised was $3.2 million during the period July 1, 2010 through October 18, 2010 and $8.1 million
for Fiscal 2010. The related excess tax benefits from stock options exercised were $1.1 million offset by $1.5 million shortfalls recorded as operating cash
flows for the period July 1, 2010 through October 18, 2010 and $3.5 million for Fiscal 2010.
Proceeds from stock options exercised were $4.0 million for the period July 1, 2010 through October 18, 2010 and $4.2 million for Fiscal 2010.
The weighted average grant date fair value of nonvested shares granted was $16.96 during the period July 1, 2010 through October 18, 2010 and
$18.35 for Fiscal 2010. The total intrinsic value of grants which vested and settled was $9.1 million during the period July 1, 2010 through October 18, 2010
and $9.6 million for Fiscal 2010.
The fair value of shares withheld by us to meet employees’ minimum statutory withholding tax requirements on the settlement of RSU’s was $2.5
million during the period July 1, 2010 through October 18, 2010 and $2.7 million for Fiscal 2010.
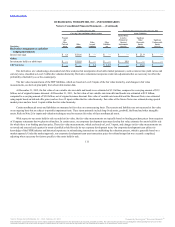
Basic earnings (loss) per share is based on net income and weighted average of common shares outstanding. For periods prior to the Merger, share count
was determined by retrospectively adjusting all Worldwide shares by the exchange ratio of 3.479129. Diluted earnings per share reflects the potential dilution
of common shares, relating to outstanding stock options and RSUs calculated using the treasury stock method. For periods prior to the Merger, outstanding
stock options and RSUs were determined by converting all Worldwide stock options to Company stock options using the exchange ratio of 3.355508 and all
Worldwide RSUs to Company RSUs using the exchange ratio of 3.479129.
119
Source: Burger King Worldwide, Inc., 10-K, February 22, 2013 Powered by Morningstar® Document Research℠
The information contained herein may not be copied, adapted or distributed and is not warranted to be accurate, complete or timely. The user assumes all risks for any damages or losses arising from any use of this
information, except to the extent such damages or losses cannot be limited or excluded by applicable law. Past financial performance is no guarantee of future results.