Burger King 2012 Annual Report Download - page 97
Download and view the complete annual report
Please find page 97 of the 2012 Burger King annual report below. You can navigate through the pages in the report by either clicking on the pages listed below, or by using the keyword search tool below to find specific information within the annual report.-
 1
1 -
2
-
3
-
4
-
5
-
6
-
7
-
8
-
9
-
10
-
11
-
12
-
13
-
14
-
15
-
16
-
17
-
18
-
19
-
20
-
21
-
22
-
23
-
24
-
25
-
26
-
27
-
28
-
29
-
30
-
31
-
32
-
33
-
34
-
35
-
36
-
37
-
38
-
39
-
40
-
41
-
42
-
43
-
44
-
45
-
46
-
47
-
48
-
49
-
50
-
51
-
52
-
53
-
54
-
55
-
56
-
57
-
58
-
59
-
60
-
61
-
62
-
63
-
64
-
65
-
66
-
67
-
68
-
69
-
70
-
71
-
72
-
73
-
74
-
75
-
76
-
77
-
78
-
79
-
80
-
81
-
82
-
83
-
84
-
85
-
86
-
 87
87 -
 88
88 -
 89
89 -
 90
90 -
 91
91 -
 92
92 -
 93
93 -
 94
94 -
 95
95 -
 96
96 -
 97
97 -
 98
98 -
 99
99 -
 100
100 -
 101
101 -
 102
102 -
 103
103 -
 104
104 -
 105
105 -
 106
106 -
 107
107 -
108
-
109
-
110
-
111
-
112
-
113
-
114
-
115
-
116
-
117
-
118
-
119
-
120
-
121
-
122
-
123
-
124
-
125
-
126
-
127
-
128
-
129
-
130
-
131
-
132
-
133
-
134
-
135
-
136
-
137
-
138
-
139
-
140
-
141
-
142
-
143
-
144
-
145
-
146
-
147
-
148
-
149
-
150
-
151
-
152
-
153
-
154
-
155
-
156
-
157
-
158
-
159
-
160
-
161
-
162
-
163
-
164
-
165
-
166
-
167
-
168
-
169
-
170
-
171
-
172
-
173
-
174
-
175
-
176
-
177
-
178
-
179
-
180
-
181
-
182
-
183
-
184
-
185
-
186
-
187
-
188
-
189
-
190
-
191
-
192
-
193
-
194
-
195
-
196
-
197
-
198
-
199
-
200
-
201
-
202
-
203
-
204
-
205
-
206
-
207
-
208
-
209
 |
 |

Table of Contents
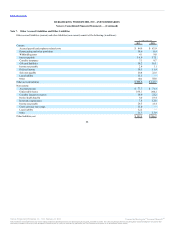
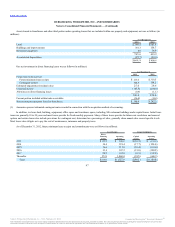
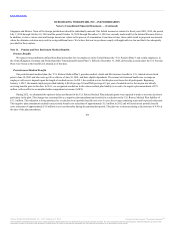
Interest expense, net consists of the following (in millions):
Tranche A Term Loans $ 7.1 $ — $ — $ — $ —
Tranche B Term Loans 7.1 — — — —
Secured Term Loan — USD tranche 51.2 75.4 19.1 — —
Secured Term Loan — Euro tranche 8.8 14.3 4.3 — —
Interest Rate Caps — USD and EURO 1.0 1.2 0.4 — —
9/% Senior Notes 78.6 78.8 16.0 — —
11.0% Discount Notes 43.8 31.0 — — —
Amortization of deferred financing costs and debt issuance
discount 13.2 15.3 2.6 — —
Predecessor term loans — — — 12.0 39.4
Capital lease obligations 8.2 9.1 1.3 2.9 10.2
Other(1) 5.9 3.2 14.6 — —
Interest income (1.1) (1.6) (0.2) (0.3) (1.0)
Total $223.8 $226.7 $58.1 $ 14.6 $ 48.6
(1) Amount includes commitment fees of $13.5 million associated with the bridge loan available at the closing of the 2010 Transactions for the period of
October 19, 2010 to December 31, 2010.
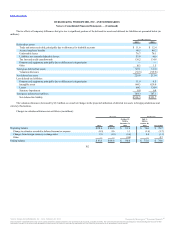
We had unamortized deferred financing costs of $53.5 million at December 31, 2012 and $57.0 million at December 31, 2011. These amounts are
classified as other assets, net and are amortized over the term of the debt into interest expense using the effective interest method. The amortization of deferred
financing costs included in interest expense was $10.9 million for 2012, $12.5 million for 2011, $2.1 million for the period October 19, 2010 to
December 31, 2010, $0.6 million for the period July 1, 2010 to October 18, 2010 and $2.1 million for Fiscal 2010.
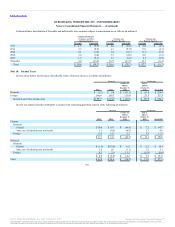
As of December 31, 2012, we leased or subleased 1,873 restaurant properties to franchisees and 54 non-restaurant properties to third parties under
direct financing leases and operating leases. Initial lease terms generally range from 10 to 20 years. Most leases to franchisees provide for fixed monthly
payments and many of these leases provide for future rent escalations and renewal options. Certain leases also include provisions for contingent rent,
determined as a percentage of sales, generally when annual sales exceed specific levels. The lessees bear the cost of maintenance, insurance and property taxes.
96
7 8
Source: Burger King Worldwide, Inc., 10-K, February 22, 2013 Powered by Morningstar® Document Research℠
The information contained herein may not be copied, adapted or distributed and is not warranted to be accurate, complete or timely. The user assumes all risks for any damages or losses arising from any use of this
information, except to the extent such damages or losses cannot be limited or excluded by applicable law. Past financial performance is no guarantee of future results.